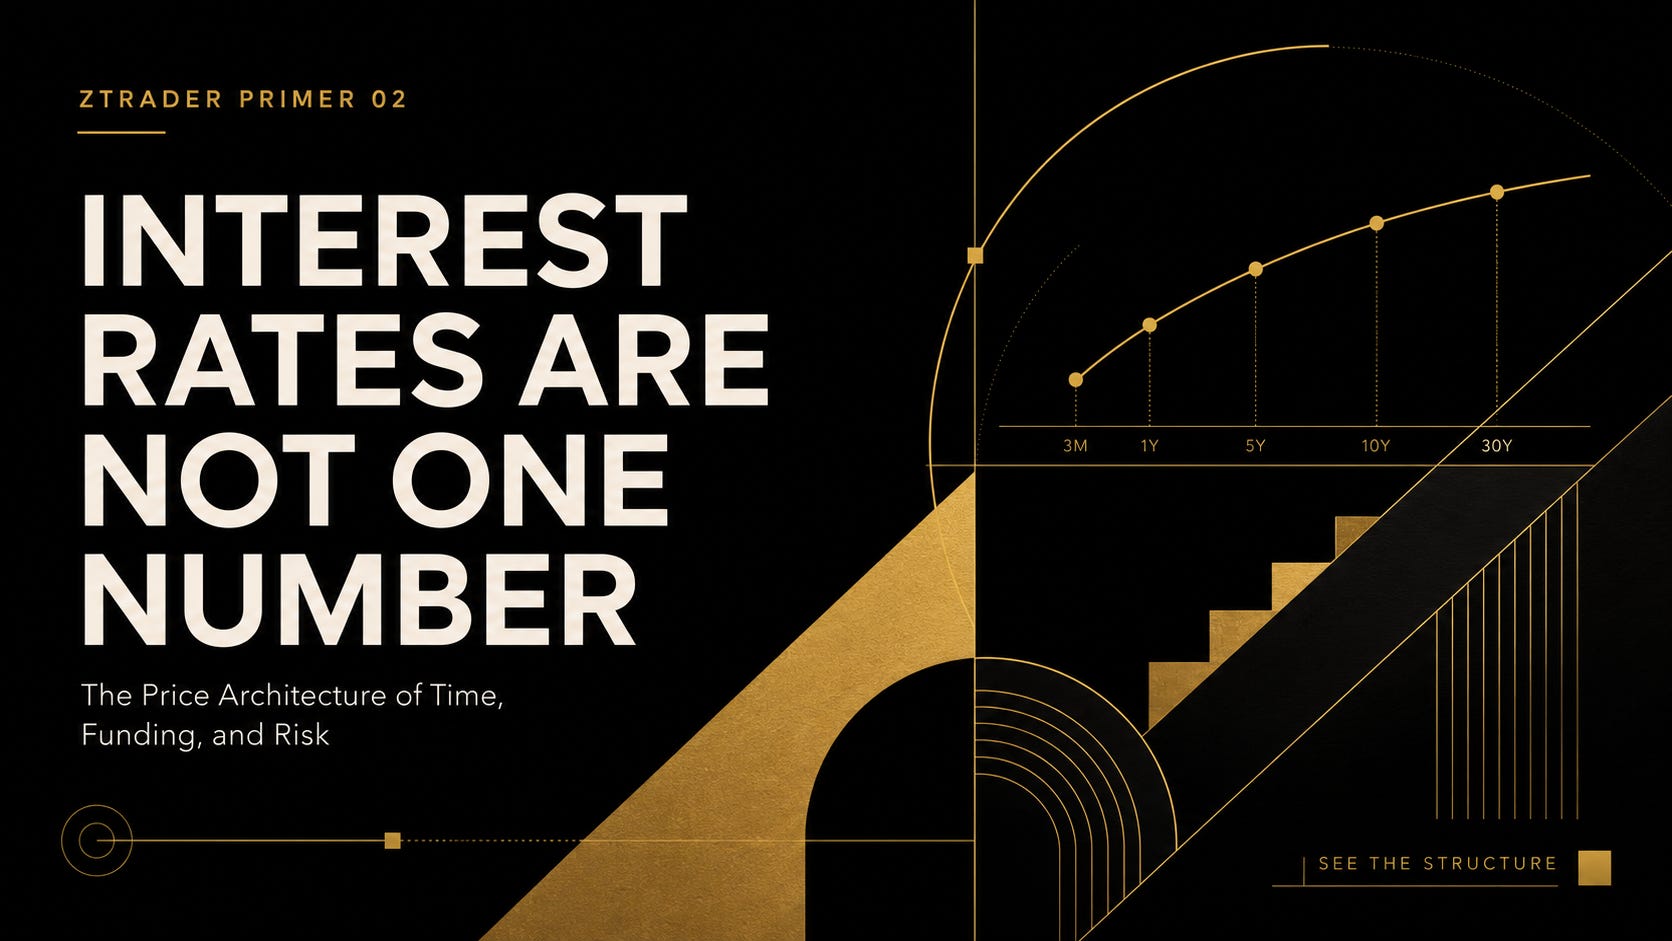
ZTRADER PRIMER 02 |Interest Rates Are Not One Number
They Are the Price Architecture of Time, Funding, and Risk
Most market commentary treats interest rates as if the financial system contains one large dial.
Rates rise.
Rates fall.
The Fed cuts.
Bond yields move.
Markets react.
Useful shorthand. Bad mental model.
There is no single interest rate.
There is an architecture of rates, each pricing a different part of the system:
The cost of overnight money
The expected path of monetary policy
The return required to lend across time
Compensation for inflation and duration risk
The premium charged for credit and liquidity risk
The final borrowing cost faced by households and companies
A central bank can cut its policy rate while mortgage rates remain elevated.
Inflation can fall while long-term government yields rise.
Nominal yields can remain stable while real yields increase.
Treasury yields can decline while corporate financing conditions tighten.
None of these outcomes is contradictory.
They occur because “interest rates” are not one price.
They are a stack.
The One-Sentence Answer
Interest rates are a system of prices that determines how capital is transferred across time, balance sheets, and risk.
The weak question is:
Are rates going up or down?
The stronger questions are:
Which rate moved?
Which component moved?
Why did it move?
Which balance sheet must react?
Direction matters.
Composition matters more.
01 | The Price of Time
An interest rate is commonly described as the cost of borrowing money.
That is correct, but incomplete.
An interest rate is also the price of exchanging resources across time.
A borrower receives purchasing power today and promises repayment later.
A lender gives up liquidity today and demands compensation for waiting, uncertainty, and risk.
Depending on the instrument, that compensation may include:
TIME VALUE
+ EXPECTED INFLATION
+ DURATION RISK
+ CREDIT RISK
+ LIQUIDITY RISK
+ OPTIONALITY
These components do not appear in equal proportions across every market.
An overnight secured rate mainly reflects immediate funding and collateral conditions.
A long-term government yield reflects the expected path of future short-term rates plus compensation for holding duration risk.
A corporate yield adds compensation for default, downgrade, liquidity, and other risks.
A mortgage rate may also incorporate prepayment optionality, funding costs, servicing expenses, and lender margins.
The rate paid by the final borrower is therefore not simply “the central-bank rate plus a little extra.”
It is the output of several interconnected markets.
02 | The Interest-Rate Stack
For practical analysis, the rate system can be organized into six layers:
CENTRAL-BANK POLICY
↓
OVERNIGHT MONEY
↓
SHORT-TERM GOVERNMENT YIELDS
↓
LONG-TERM GOVERNMENT YIELDS
↓
CREDIT AND LIQUIDITY SPREADS
↓
FINAL BORROWING COST
This is an analytical map, not a mechanical timetable.
Markets anticipate policy before central banks act.
Credit spreads can move independently of government yields.
Long-term yields can rise because of term premium, fiscal supply, or inflation uncertainty even when the expected policy path is declining.
The stack tells us where to look.
It does not promise that every layer will move in the same direction.
Layer One: Central-Bank Policy
In the United States, the Federal Reserve establishes a target range for the federal funds rate and uses administered rates and liquidity facilities to keep overnight market rates near that range.
The policy rate therefore anchors short-term money-market conditions, but it does not directly set every yield in the financial system.
Policy affects markets through more than the current overnight rate.
It also changes:
Expectations for future rates
The cost and attractiveness of leverage
Deposit and money-market yields
Currency-rate differentials
Lending standards
Discount rates
Risk appetite
The policy rate is the anchor.
It is not the entire ship.
Layer Two: Overnight Money
Overnight rates reveal the immediate price of liquidity.
This layer includes secured and unsecured funding markets, such as repo and interbank lending.
It matters directly to:
Banks
Dealers
Hedge funds
Money-market funds
Derivatives users
Leveraged relative-value strategies
When overnight markets function normally, policy transmission tends to begin cleanly.
When repo rates, funding spreads, or collateral haircuts become unstable, the same policy stance can produce much tighter conditions for leveraged participants.
This is where monetary policy becomes an actual financing cost rather than a press-conference sentence.
Layer Three: Short-Term Government Yields
Short-term government yields are heavily influenced by the expected path of monetary policy.
The two-year Treasury yield, for example, tends to respond strongly when inflation, employment, growth, or central-bank communication changes expectations for future policy.
But the two-year yield is not a pure forecast of the policy rate.
It can also contain:
Term premium
Liquidity effects
Positioning
Hedging demand
Risk aversion
A short-term yield can fall before the central bank cuts.
It can rise while the current policy rate remains unchanged.
The front end is best understood as market pricing of the expected policy path, plus risk and technical components.
Layer Four: Long-Term Government Yields
Long-term nominal government yields can be represented as:
LONG-TERM NOMINAL YIELD
≈ EXPECTED AVERAGE FUTURE NOMINAL SHORT RATES
+ TERM PREMIUM
The term premium is the additional compensation investors require for bearing the risk of holding a long-duration security rather than repeatedly investing at short maturities.
New York Fed research explicitly decomposes Treasury yields into expected future short rates and term premium.
This distinction is essential.
Long-term yields can rise because markets expect higher future policy rates.
They can also rise because investors demand more compensation for:
Inflation uncertainty
Fiscal supply
Duration exposure
Central-bank credibility risk
Market volatility
Reduced demand for long bonds
A central bank can therefore cut its policy rate while the long end rises.
The long end is not necessarily fighting the central bank.
It may be pricing a different risk.
Layer Five: Credit and Liquidity Spreads
Government yields are only the base rate for private borrowers.
A simplified corporate borrowing yield is:
CORPORATE YIELD
≈ COMPARABLE GOVERNMENT YIELD
+ CREDIT AND LIQUIDITY SPREAD
The spread may compensate investors for:
Default probability
Recovery uncertainty
Downgrade risk
Liquidity risk
Market risk
Embedded options
Balance-sheet stress
This means that falling Treasury yields do not guarantee cheaper corporate funding.
During risk-off periods, government yields may decline while credit spreads widen.
In severe stress, wider spreads and deteriorating market liquidity can restrict issuance even when benchmark yields are falling.
The risk-free layer can ease while the credit layer tightens.
That is why Treasury yields alone do not describe financial conditions.
Layer Six: Final Borrowing Cost
The rate paid by a household or company may include:
REFERENCE YIELD
+ TERM OR DURATION PREMIUM
+ CREDIT SPREAD
+ LIQUIDITY PREMIUM
+ OPTIONALITY
+ CAPITAL AND OPERATING COSTS
Pass-through from monetary policy to mortgages and corporate borrowing costs is meaningful, but it varies across instruments, maturities, market structures, and policy regimes.
Federal Reserve research shows that policy-induced movements in Treasury yields can transmit strongly into corporate and mortgage borrowing costs, while the spreads layered above Treasury yields may still move independently.
This explains why a central-bank cut may not immediately produce:
Lower fixed mortgage rates
Easier small-business financing
Cheaper high-yield debt
Better access to bank credit
Monetary transmission is real.
It is neither instantaneous nor uniform.
Chart 01 | The Interest-Rate Stack
Source line: Ztrader Research framework; Federal Reserve and Federal Reserve Bank of New York.
03 | Short Rates and Long Rates Price Different Risks
The short and long ends of the curve do not carry the same information.
The front end is more sensitive to expected monetary policy.
The long end contains the expected path of nominal short rates plus term premium.
The relationship between them creates the yield curve.
A curve move has two dimensions:
DIRECTION
Did yields rise or fall?
SLOPE
Did short or long yields move more?
In bond-market terminology:
Bull means yields are falling and bond prices are rising.
Bear means yields are rising and bond prices are falling.
Steepening means the gap between long and short yields is increasing.
Flattening means that gap is decreasing.
Humanity has naturally chosen vocabulary in which a bull market can mean falling numbers. Apparently ordinary clarity was considered insufficiently financial.
Bull Steepening
Short-term yields fall more than long-term yields.
SHORT YIELD ↓↓↓
LONG YIELD ↓
CURVE STEEPENS
This often occurs when markets price policy easing.
It may reflect benign disinflation.
It may also reflect fear that the central bank will need to cut aggressively because growth is weakening.
The curve shape does not reveal the regime by itself.
Bear Steepening
Long-term yields rise more than short-term yields.
SHORT YIELD ↑
LONG YIELD ↑↑↑
CURVE STEEPENS
Possible drivers include:
Stronger long-term growth expectations
Higher inflation uncertainty
Rising term premium
Heavy government issuance
Fiscal credibility concerns
A bear steepener can tighten financial conditions even if the near-term policy path changes very little.
Bull Flattening
Long-term yields fall more than short-term yields.
SHORT YIELD ↓
LONG YIELD ↓↓↓
CURVE FLATTENS
This can occur when long-run growth or inflation expectations decline, safe-haven demand rises, or term premium compresses.
It may support duration assets.
It may also signal a darker economic outlook.
Bear Flattening
Short-term yields rise more than long-term yields.
SHORT YIELD ↑↑↑
LONG YIELD ↑
CURVE FLATTENS
This is commonly associated with tighter expected monetary policy.
The front end reprices sharply while the long end rises less because markets expect inflation or growth to weaken later.
Federal Reserve research similarly shows that shocks concentrated in short rates tend to flatten the curve when their effect declines across longer maturities.
The Curve Is a Relative Price, Not a Prophecy
The yield curve compares the price of money across maturities.
Its shape contains information about:
Policy expectations
Growth
Inflation
Term premium
Fiscal supply
Hedging demand
Risk appetite
An inversion can contain recession information.
It does not provide a countdown clock.
A curve is a market price shaped by expectations and risk premia, not a message delivered by an unusually well-dressed oracle.
04 | Nominal Yields, Real Yields, and Inflation Compensation
A nominal government yield compensates investors in currency units.
A real yield attempts to remove the effect of inflation.
A more accurate simplified relationship is:
NOMINAL YIELD
≈ REAL YIELD
+ EXPECTED INFLATION
+ INFLATION RISK PREMIUM
Federal Reserve research notes that nominal yields include real yields, expected inflation, and inflation-risk compensation.
The difference between a nominal Treasury yield and a comparable TIPS yield is often called breakeven inflation or inflation compensation.
It is not a pure measure of expected inflation.
It can also contain:
Inflation risk premium
Liquidity differences
Market technicals
The Federal Reserve therefore describes these market measures as implied inflation compensation rather than a clean reading of expected inflation alone.
When Real Yields Rise
Higher real yields increase the inflation-adjusted return available on safer assets.
They may:
Raise discount rates
Pressure long-duration valuations
Increase the opportunity cost of holding non-yielding assets
Support the dollar through relative-return channels
Tighten external financing conditions
These are tendencies, not physical laws.
The final response depends on earnings, fiscal risk, positioning, liquidity, and the reason real yields are rising.
When Inflation Compensation Rises
Higher inflation compensation may reflect:
Stronger demand
Supply disruption
Fiscal expansion
Commodity pressure
Reduced policy credibility
Greater uncertainty about future inflation
The asset response depends on whether stronger nominal growth or higher inflation risk dominates.
Stocks may initially benefit from stronger revenues.
Margins may later weaken if costs rise faster.
Bonds may fall as investors demand more compensation.
Currencies may respond to the expected central-bank reaction rather than inflation itself.
When Nominal Yields Fall
Lower yields are not automatically bullish.
They may reflect:
Disinflation
Slower growth
Expected policy easing
Safe-haven demand
Financial stress
Falling term premium
A yield decline caused by softer inflation and stable growth may support risk assets.
A decline caused by collapsing growth expectations may occur alongside weaker equities and wider credit spreads.
“Rates down” is not a thesis.
It is an observation waiting for decomposition.
Chart 02 | Why a Nominal Yield Moves
Source line: Ztrader Research framework; Federal Reserve and Federal Reserve Bank of New York.
05 | How Rates Enter Asset Prices
Interest rates affect markets through several channels.
No channel dominates in every regime.
The Discount-Rate Channel
Asset values depend partly on expected future cash flows and the return investors require for holding them.
ASSET VALUE
≈ FUTURE CASH FLOWS
÷ REQUIRED RETURN
Higher required returns reduce the present value of distant cash flows, all else equal.
This makes long-duration assets more sensitive to real yields and risk premia.
But if yields rise because expected growth and earnings are also increasing, stronger cash flows may offset some or all of the valuation pressure.
Higher rates do not affect price in isolation.
They interact with the numerator.
The Funding Channel
Higher rates increase the cost of leverage and refinancing.
This matters to:
Property
Banks
Leveraged funds
Highly indebted companies
Private equity
Households
Governments
A business model that works with 2% financing may fail with 7% financing.
The underlying asset does not need to become less productive.
Its capital structure may simply stop working.
The Credit Channel
Monetary policy affects both the price and availability of credit.
Banks may respond to tighter conditions by raising lending rates, increasing collateral requirements, or tightening credit standards.
Central-bank research emphasizes that adjustments in lending standards form an important part of monetary-policy transmission alongside changes in market interest rates.
The quantity of available financing can matter as much as its price.
The Currency Channel
Rate differentials affect carry and international capital allocation.
Higher expected rates can support a currency.
But the result depends on:
Inflation
Growth
Fiscal credibility
External balances
Hedging costs
Risk appetite
Positioning
A high yield may represent economic strength.
It may also be compensation for instability.
Sometimes carry is income.
Sometimes it is hazard pay.
The Portfolio-Allocation Channel
Higher safe yields change the hurdle rate for every risky asset.
When investors can earn more on government securities or cash instruments, equities, credit, property, and private assets must offer greater expected compensation.
The safe rate therefore competes for capital.
It does not merely discount future cash flows.
The Expectations Channel
Markets move before central banks act.
Guidance, forecasts, economic data, and changes in the perceived reaction function can shift the expected path of rates immediately.
A central bank can tighten financial conditions without changing its current policy rate.
The market may do the tightening on its behalf, with customary enthusiasm and none of the accountability.
06 | Rate Cuts Are Not Automatically Bullish
A rate cut can occur in two very different environments.
Normalization or Insurance Cut
Inflation ↓
Growth Stable
Credit Stable
Earnings Resilient
Policy Restriction Reduced
This combination can support risk assets.
Stress or Emergency Cut
Growth ↓↓
Credit Spreads ↑
Defaults ↑
Lending Standards Tighten
Policy Reacts to Damage
This combination may arrive alongside falling equities and deteriorating credit.
The Federal Reserve lowers rates during economic downturns to support broader financial conditions, but policy easing cannot instantly remove existing credit losses, funding stress, or weak demand.
The action is the same.
The information contained in the action is not.
07 | Rising Yields Are Not Automatically Bearish
Rising yields can represent stronger growth.
They can also represent deteriorating inflation or fiscal risk.
Growth-Led Yield Rise
Growth Expectations ↑
Earnings Expectations ↑
Credit Stable
Risk Appetite Stable
Equities may absorb higher discount rates if expected cash flows improve sufficiently.
Risk-Premium-Led Yield Rise
Term Premium ↑
Inflation Risk ↑
Fiscal Concern ↑
Funding Pressure ↑
This is more likely to tighten conditions across duration-sensitive assets.
The important distinction is not simply:
Did yields rise?
It is:
Which component required investors to demand a higher return?
08 | Five Common Errors
Error One: Treating the Policy Rate as the Whole Market
The central bank most directly anchors overnight rates.
It does not mechanically set long-term yields, mortgage rates, corporate spreads, or every final borrowing cost.
Error Two: Ignoring the Component Behind the Move
A yield increase driven by stronger growth is different from one driven by term premium or inflation uncertainty.
Direction without decomposition is incomplete.
Error Three: Treating Breakevens as Pure Inflation Expectations
Breakeven inflation also contains inflation-risk and liquidity components.
It is a market price, not a laboratory reading.
Error Four: Assuming Lower Treasury Yields Mean Easier Credit
Treasury yields can fall while credit spreads widen and bank standards tighten.
The base rate and the risk spread must be read together.
Error Five: Trading Only the First-Order Effect
A rate increase may initially support a currency.
Later, tighter policy may weaken growth, damage credit, and reverse the currency move.
Rate transmission occurs in stages.
Markets inconveniently continue existing after the first candle.
09 | How to Read Rates Each Day
Step One: Locate the Move
Which maturity changed?
Overnight
2-year
5-year
10-year
30-year
Step Two: Decompose It
Was the move driven by:
Expected policy
Real yields
Inflation compensation
Term premium
Fiscal supply
Credit stress
Market liquidity
Step Three: Classify the Curve
Was it:
Bull steepening
Bear steepening
Bull flattening
Bear flattening
Step Four: Identify the Transmission Channel
Does the move primarily affect:
Discount rates
Funding
Credit
Currency
Portfolio allocation
Bank profitability
Step Five: Demand Confirmation
Check:
DXY
Gold
Equities
Credit spreads
Banks
Property-sensitive assets
VIX
MOVE
If the other markets do not confirm the rates story, the decomposition may be wrong, the time horizons may differ, or positioning may be dominating the initial move.
Chart 03 | The Daily Rates Dashboard
01 | POLICY
Policy Rate · Central-Bank Guidance
Expected Cuts / Hikes · Meeting Pricing
02 | OVERNIGHT FUNDING
SOFR · Effective Fed Funds
Repo Stress · Funding Spreads
03 | FRONT END
2Y Yield · 5Y Yield
Expected Policy Path
04 | CURVE
2s10s · 5s30s
Steepening · Flattening · Inversion
05 | REAL RATES AND INFLATION
5Y / 10Y Real Yields
Breakevens · Inflation Compensation
06 | TERM PREMIUM AND SUPPLY
Term-Premium Estimates
Treasury Issuance · Auction Demand
07 | CREDIT
IG Spreads · HY Spreads
Bank Lending · Default Expectations
08 | CROSS-ASSET CONFIRMATION
DXY · Gold · Equities · Banks
Property · VIX · MOVE
Source line: Ztrader Research monitoring framework.
10 | From Rates View to Trade
A rates-based thesis should contain six steps:
OBSERVATION
↓
DECOMPOSITION
↓
TRANSMISSION
↓
EXPECTED CONFIRMATION
↓
INSTRUMENT
↓
INVALIDATION
Consider an example.
Observation
The 10-year yield is rising while the 2-year yield remains relatively stable.
Decomposition
The move is concentrated in the long end.
Possible drivers include:
Higher term premium
Increased duration supply
Stronger long-term growth expectations
Inflation or fiscal uncertainty
Transmission
Higher long-term yields may pressure duration-sensitive assets and increase mortgage or corporate borrowing costs.
Expected Confirmation
Look for:
Curve steepening
Higher real yields
Weakness in long-duration equities
Pressure on rate-sensitive property
Changes in Treasury-auction demand
Credit-spread behavior
Dollar confirmation
Instrument
Choose an expression with:
Direct exposure
Sufficient liquidity
Acceptable carry
Defined convexity
Clear invalidation
Invalidation
The thesis weakens if:
The long-end move reverses
Real yields fail to confirm
Auction and supply pressure recedes
Credit and duration-sensitive assets remain resilient
Evidence shows the move was growth-led rather than risk-premium-led
A rates trade is not:
Yields are rising, so short everything.
It is:
This part of the curve is repricing for this reason. These assets should respond through these channels. These observations would prove the mechanism wrong.
Primer Card 02
Interest Rates Are Not One Number
1. Which Rate Moved?
Policy, overnight, short-term, long-term, real, or credit?
2. Which Component Moved?
Expected policy, real rates, inflation compensation, term premium, or credit spread?
3. What Happened to the Curve?
Bull or bear?
Steepening or flattening?
4. Which Channel Matters?
Discount rate, funding, credit, currency, or allocation?
5. Which Balance Sheet Is Exposed?
Banks, households, companies, funds, property, or governments?
6. Which Assets Should Confirm It?
Dollar, gold, equities, credit, banks, property, or volatility?
7. What Invalidates the Thesis?
Which yield, spread, or cross-asset signal would prove the mechanism wrong?
Final Takeaway
Interest rates are not one number. They are the pricing architecture of the financial system.
The policy rate anchors overnight money.
The front end prices expected central-bank behavior.
The long end prices expected future short rates and term premium.
Real yields reveal the inflation-adjusted return demanded by investors.
Credit spreads price the vulnerability and liquidity of private balance sheets.
The final borrowing rate determines what households and companies can actually finance.
When rates move, do not stop at direction.
Locate the maturity.
Decompose the component.
Classify the curve.
Trace the transmission.
Demand confirmation.
The market does not trade “rates.”
It trades which rate changed, why it changed, and which balance sheet must react next.
ZTRADER PRIMER 02
Interest Rates Are Not One Number
The Price Architecture of Time, Funding, and Risk.
ZTRADER.AI
SEE THE STRUCTURE


