

By Dorian
ZTrader | Macro & Market Structure Research | November 19, 2026
Most gold bulls are suffering from their long positions, and now they are facing the real market stress testing.
Is Walsh going to be the Volcker 2.0?
This is the most crucial question in their minds.
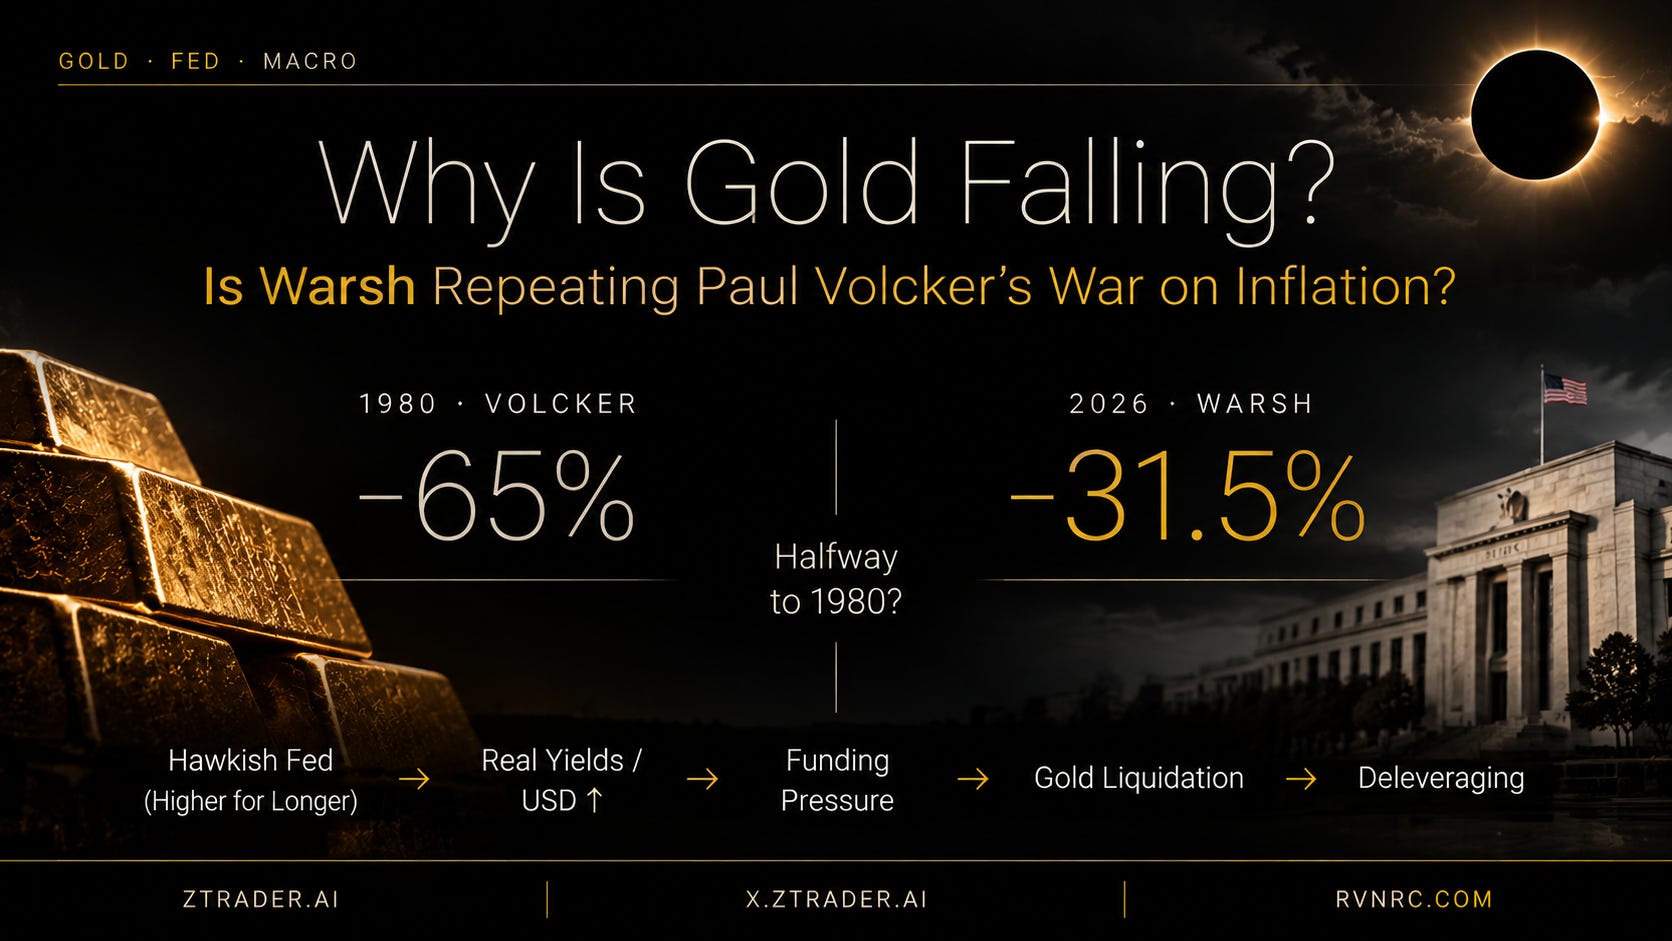
Gold fell to $3,830.74 a troy ounce on November 16, 31.5% below the record it set in January.
That record came one day before President Trump named Kevin Warsh to run the Federal Reserve.
Ten months later, Warsh’s Fed has raised rates once, and traders expect it to raise them again in December.
Most explanations for the sell-off stop at the usual list of higher Treasury yields, a stronger dollar and hawkish Fed talk. Those forces share one source: a Federal Reserve that has decided to fight inflation with higher rates, and a gold market that has priced that decision, one hawkish signal at a time, since the day Warsh was nominated.
The last time a Fed chair took office with a mandate to break inflation thoroughly, gold price peaked within months and then lost almost two-thirds of its value.
That history may explains what and why gold price has dropped so much till now, and it also tells traders what to watch when the price hits the bottom.
We are seeing very similar massive gold sell-off patterns here, this clearly shows that investors are dumping gold because they need dollar liquidity.
I. WHAT IS THE GOLD MARKET PRICING NOW?
Every time the Fed is about to tightening monetarily, we are seeing gold price react to it, more sell-offs are responding to the Fed’s move.
The Warsh Shock: January 30
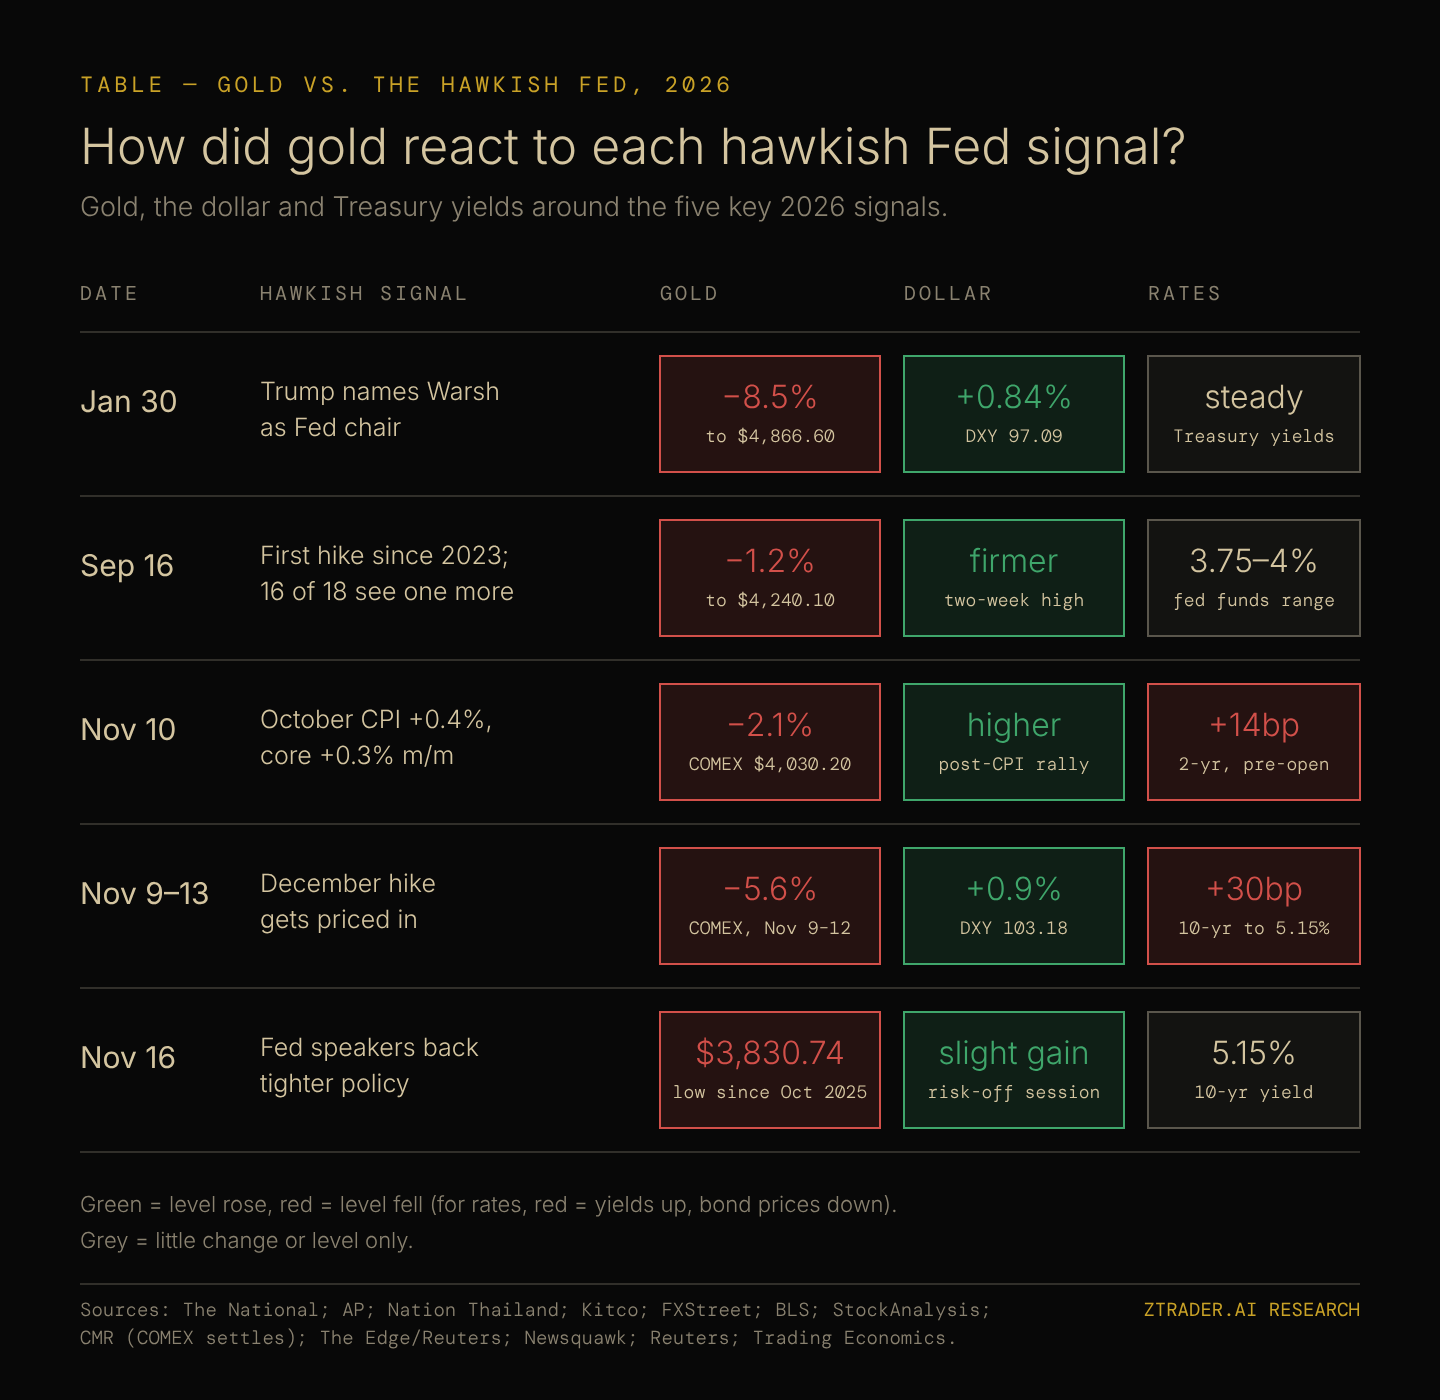
As Gold price peaked at $5,594.82 in January, and the run ended the day President Trump nominated Kevin Warsh as Fed chair. Spot gold fell 8.5% to $4,866.60 by 4pm Eastern time on January 30, while the dollar index rose 0.84%.
Some on Wall Street read the pick as the signal of an independent Fed that would keep rates high if it had to, and the debasement trade that had carried gold above $5,500 began to unwind that day.
The First Hike: September 16
The Fed raised its benchmark rate by 25 basis points on September 16, to a range of 3.75% to 4%, in a 12-0 vote.
The decision was the first rate increase since July 2023, and 16 of the 18 officials who submitted projections expected at least one more hike before the end of 2026. Gold fell 1.2% to $4,240.10 by mid-afternoon in New York. The metal bounced about 2% the next day because traders had priced the hike in advance; what mattered for gold was how many further hikes the market would add.
The Inflation Print: November 10
The October consumer price report answered that question. Headline CPI rose 0.4% for the month against a 0.3% forecast, and core CPI rose 0.3% against 0.2%.
The latest annual figures, for September, showed headline inflation at 3.7% and core at 2.6%, and the Labor Department could not publish an October annual rate because the 2025 government shutdown left no October 2025 base.
Fed Governor Christopher Waller said in London a few hours before the release that a 50-basis-point hike should be considered in December if core CPI rose 0.3% or more, and core CPI then rose 0.3% for a third straight month. COMEX gold fell 2.05% that day to $4,030.20, the two-year Treasury yield jumped from 4.55% to 4.69% before the open, and fed funds futures ended the day pricing about 28 basis points of tightening for December.
The Repricing Week: November 9 to 16
The rest of the week turned the inflation print into a rate path.
The 10-year Treasury yield rose 30 basis points over the week to 5.15%, the dollar index posted its biggest weekly gain since September at 103.18, and COMEX gold fell 5.57% across the three sessions from November 9 to November 12. Gold then hit its low of $3,830.74 on November 16, as Fed officials lined up behind tighter policy ahead of a speech by Warsh.
[TABLE — How did gold react to each hawkish Fed signal?]
Real Yields: The Number Gold Has to Compete With
What are real yields?
The 10-year Treasury Inflation-Protected Security, or TIPS, pays a yield above inflation, so traders use it as the market’s real interest rate. Gold pays nothing, which means every rise in the real yield raises the cost of holding it.
The 10-year TIPS yield stood at 2.66% on November 9, up from 1.84% a year earlier, and it touched 2.95% on October 5. The September 10-year TIPS auction cleared at its highest real yield in nearly 18 years.
The 10-year breakeven inflation rate, which measures the inflation the bond market expects, sat at just 2.26% on November 13. Inflation expectations have stayed calm, so the rise in nominal yields has come almost entirely through real rates, the exact channel that hurts gold most.
Gold is falling because a credible, hawkish Fed has pushed real yields to levels that make a non-yielding asset expensive to own.
II. HOW DID GOLD TRADE WHEN PAUL VOLCKER WENT TO WAR ON INFLATION?
The closest precedent for a Fed chair who arrives to break inflation is Paul Volcker, and his first three years show how gold responds to that kind of central bank.
Volcker’s Arrival: 1979
President Carter nominated Volcker as Fed chair on July 25, 1979. On the evening of October 6, 1979, Volcker held a rare Saturday press conference to announce that the Fed would target the money supply and let interest rates rise as far as needed. The federal funds rate, which had averaged 11.2% in 1979, climbed to a peak of 20% in June 1981, and consumer price inflation peaked at 14.8% in March 1980.
Gold Topped Before Rates Did
Gold rose from $300 in July 1979 to $400 in October and $500 in December, then hit its record London closing price of $850 on January 21, 1980. Two mornings later it traded at $650. By March 17, 1980, the price had fallen to $480, a loss of about 44% in eight weeks. The federal funds rate would not peak for another seventeen months. The gold market priced the Volcker regime long before Volcker finished delivering it, which is exactly what the gold market has done since January 2026.
The Long Grind to the Bottom
The decline did not end with the first crash.
The World Gold Council’s history shows gold falling 52% between September 1980 and June 1982, and the June 1982 low of $297 left the metal about 65% below its 1980 record. The federal funds rate stayed above 14% from February to June 1982, and the Fed began cutting its policy rate in July 1982, one month after gold’s low. By October 1982, inflation had fallen to 5%. Gold rallied 57% from its June 1982 low.
[TABLE — Is gold following the 1980 script?]
In Volcker‘s era, gold price crashed on the expectation of tight money and bottomed one month before the Fed’s first cut.
III. THE COMPARISON: 2026 VS 1980
The Volcker inflation playbook explains the direction of gold’s move, but there are three major differences that explain why this gold price decline has been a lot weaker and why the gold price could reverse faster.
1. Inflation is far lower:
CPI peaked at 14.8% in 1980, while the latest annual reading in 2026 is 3.7%. Volcker pushed the federal funds rate to about 20%, while Warsh’s Fed sits at 3.75% to 4%. The comparison works through real yields, where the 10-year TIPS rate near 18-year highs plays the role that double-digit policy rates played in 1981.
2. Central banks are major gold buyers this time:
The IMF completed a five-year gold sales program in 1980, so official holders added supply into the crash. Central banks bought 675 tonnes in the first nine months of 2026, including 321 tonnes in the third quarter, their largest quarter since late 2024. That official bid sits under the market in a way it never did under Volcker, and it helps explain why gold has lost 31.5% instead of 65%.
3. The White House wants the opposite policy:
President Trump picked Warsh to deliver the lowest rates in the world, and Warsh delivered the first rate hike of Trump’s second term instead. Trump called the rate-setting committee “clowns” for wanting the hike. Volcker held his course through two recessions long and he did not bend. If in future if Warsh bends to political pressure, which is not likely the case, the hawkish discount built into gold may unwind quickly.
IV. IS THIS ALSO A DOLLAR LIQUIDITY TRAP?
Rate repricing explains most of the decline, yet several sharp down days arrived alongside equity crashes, which raises a separate question about the gold forced selling, it may also tell you another version of the story.
Why Safe Havens Assets Get Sold First
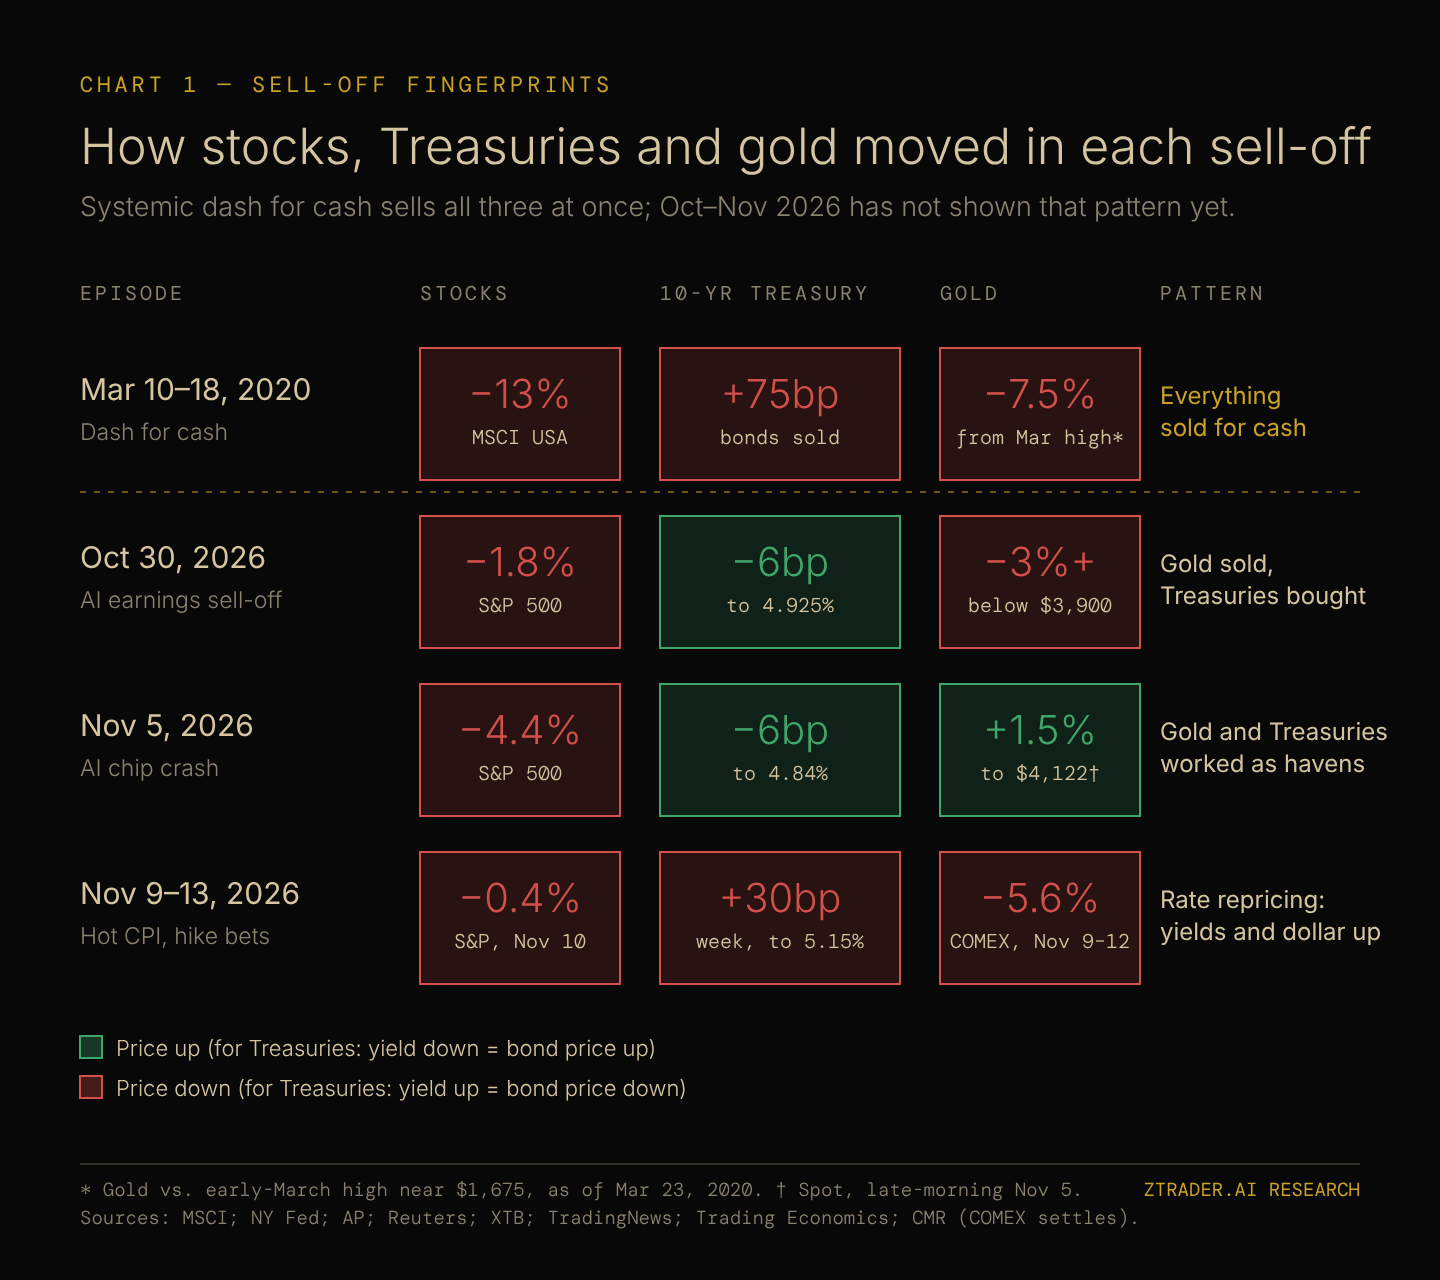
Gold carries no credit risk and trades in a deep market around the clock, which makes it a store of value and also one of the first assets a leveraged investor sells to meet a margin call. In March 2020, that logic turned into a dash for cash. Between March 10 and March 18, 2020, the MSCI USA index fell about 13%, the 10-year Treasury yield rose 75 basis points as investors sold bonds, and gold had dropped about 7.5% from its early-March high by March 23. Investors sold everything that could be turned into dollars.
Unveiling the Three Major Gold Sell-offs
The October and November massive gold sell-offs have similar mechanisms.
On October 30, the S&P 500 fell 1.8% and the Nasdaq Composite fell 2.9% after disappointing technology earnings, and gold dropped more than 3% to below $3,900; Commerzbank analysts said the tech sell-off may have forced margin-driven selling of havens like gold.
On that same day, though, the 10-year Treasury yield fell 6 basis points to 4.925% as investors bought bonds.
On November 5, the S&P 500 fell 4.4% in its worst day since April 2025, yet gold traded 1.5% higher at $4,121.74 by late morning and the 10-year yield fell to 4.84%. Gold and Treasuries both functioned as asset havens.
The heavy gold losses came instead in the week of November 9, when yields and the dollar rose together on rate expectations.
[CHART 1 — How stocks, Treasuries and gold moved in each sell-off]
Who Has Been Selling Gold
The flow data shows some liquidation without a broad exit.
US-listed gold ETFs lost $512 million in October, the only regional outflow worldwide, and the World Gold Council said some investors turned to their gold holdings as a ready source of liquidity after technology stocks sold off.
COMEX net long positions fell by 94 tonnes over the month. Global ETF holdings still rose 19 tonnes to a record 4,275 tonnes, and hedge funds’ net long position in COMEX gold, about 104,000 contracts on November 3, sat close to its 20-year average.
Forced selling explains some bad days for gold, while the equity sell-offs that should have triggered a dash for cash pushed investors into Treasuries.
V. CHECKING THE PLUMBING: REPO, BASIS TRADES AND OFFSHORE DOLLARS
Any true liquidity trap would show up first in the funding markets, so each part of the plumbing deserves a direct check.
Repo: Tight Reserves, No Run
What is repo?
Repo is a short-term loan in which a borrower hands over Treasury securities as collateral and receives cash, and SOFR is the benchmark rate for those overnight loans.
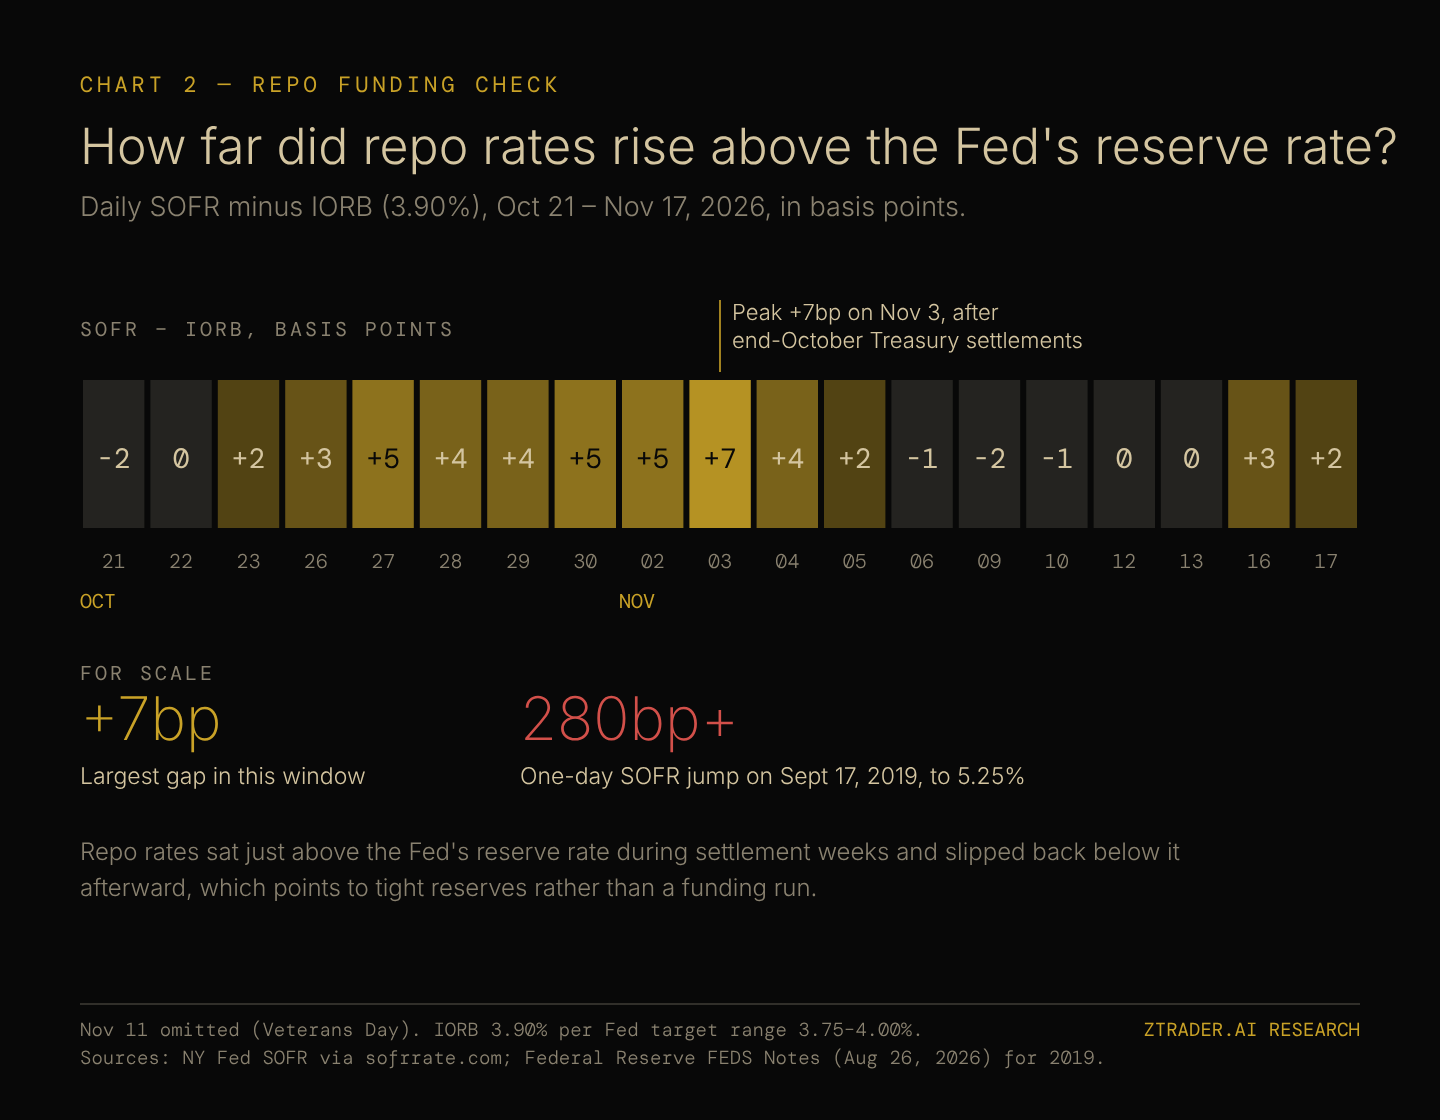
When SOFR trades well above the interest the Fed pays banks on reserves, known as IORB and currently 3.90%, cash is scarce in the system. SOFR peaked 7 basis points above IORB on November 3, after heavy end-October Treasury settlements, and it slipped back below IORB within a week.
The September 2019 repo spike, by comparison, lifted SOFR more than 280 basis points in a single day. Cleveland Fed President Beth Hammack has suggested requiring banks to use the Fed’s standing repo facility daily, which tells traders that reserves are tight, while the rate data shows no funding run.
[CHART 2 — How far did repo rates rise above the Fed’s reserve rate?]
Basis Trades: Shrinking on Their Own
What is the Treasury basis trade?
Hedge funds buy cash Treasury bonds with repo financing and sell matching futures to earn the small gap between them, using heavy leverage to make the trade pay.
The IMF’s April 2026 Global Financial Stability Report put the trade at roughly $1 trillion and warned that its unwind could amplify stress. Morgan Stanley estimates reported by Bloomberg and Reuters in September put leveraged basis positions at between $900 billion and $1.2 trillion, down from about $1.26 trillion at the start of the year, and the strategists attributed the decline to thinner profit opportunities, with no sign of systemic stress.
The trade has been shrinking slowly, which lowers the risk of a sudden, forced unwind.
Offshore Dollars: The Yen Under Pressure
What is the cross-currency basis?
It measures how much extra a foreign investor pays to borrow dollars through a currency swap, and it widens when offshore dollar funding gets scarce. No public reading for November 2026 was available for this article.
The yen briefly touched 160 per dollar on November 12, and Japan’s finance minister warned that Tokyo would respond to currency volatility; Japan had already spent ¥15.4 trillion defending the yen after it sank to 163.99 in late July. Japanese holders of US Treasuries face rising hedging costs whenever the dollar strengthens this way, which makes the yen basis the signal most worth adding to any watchlist.
[CHART 3 — Which of the five warning signals are flashing?]
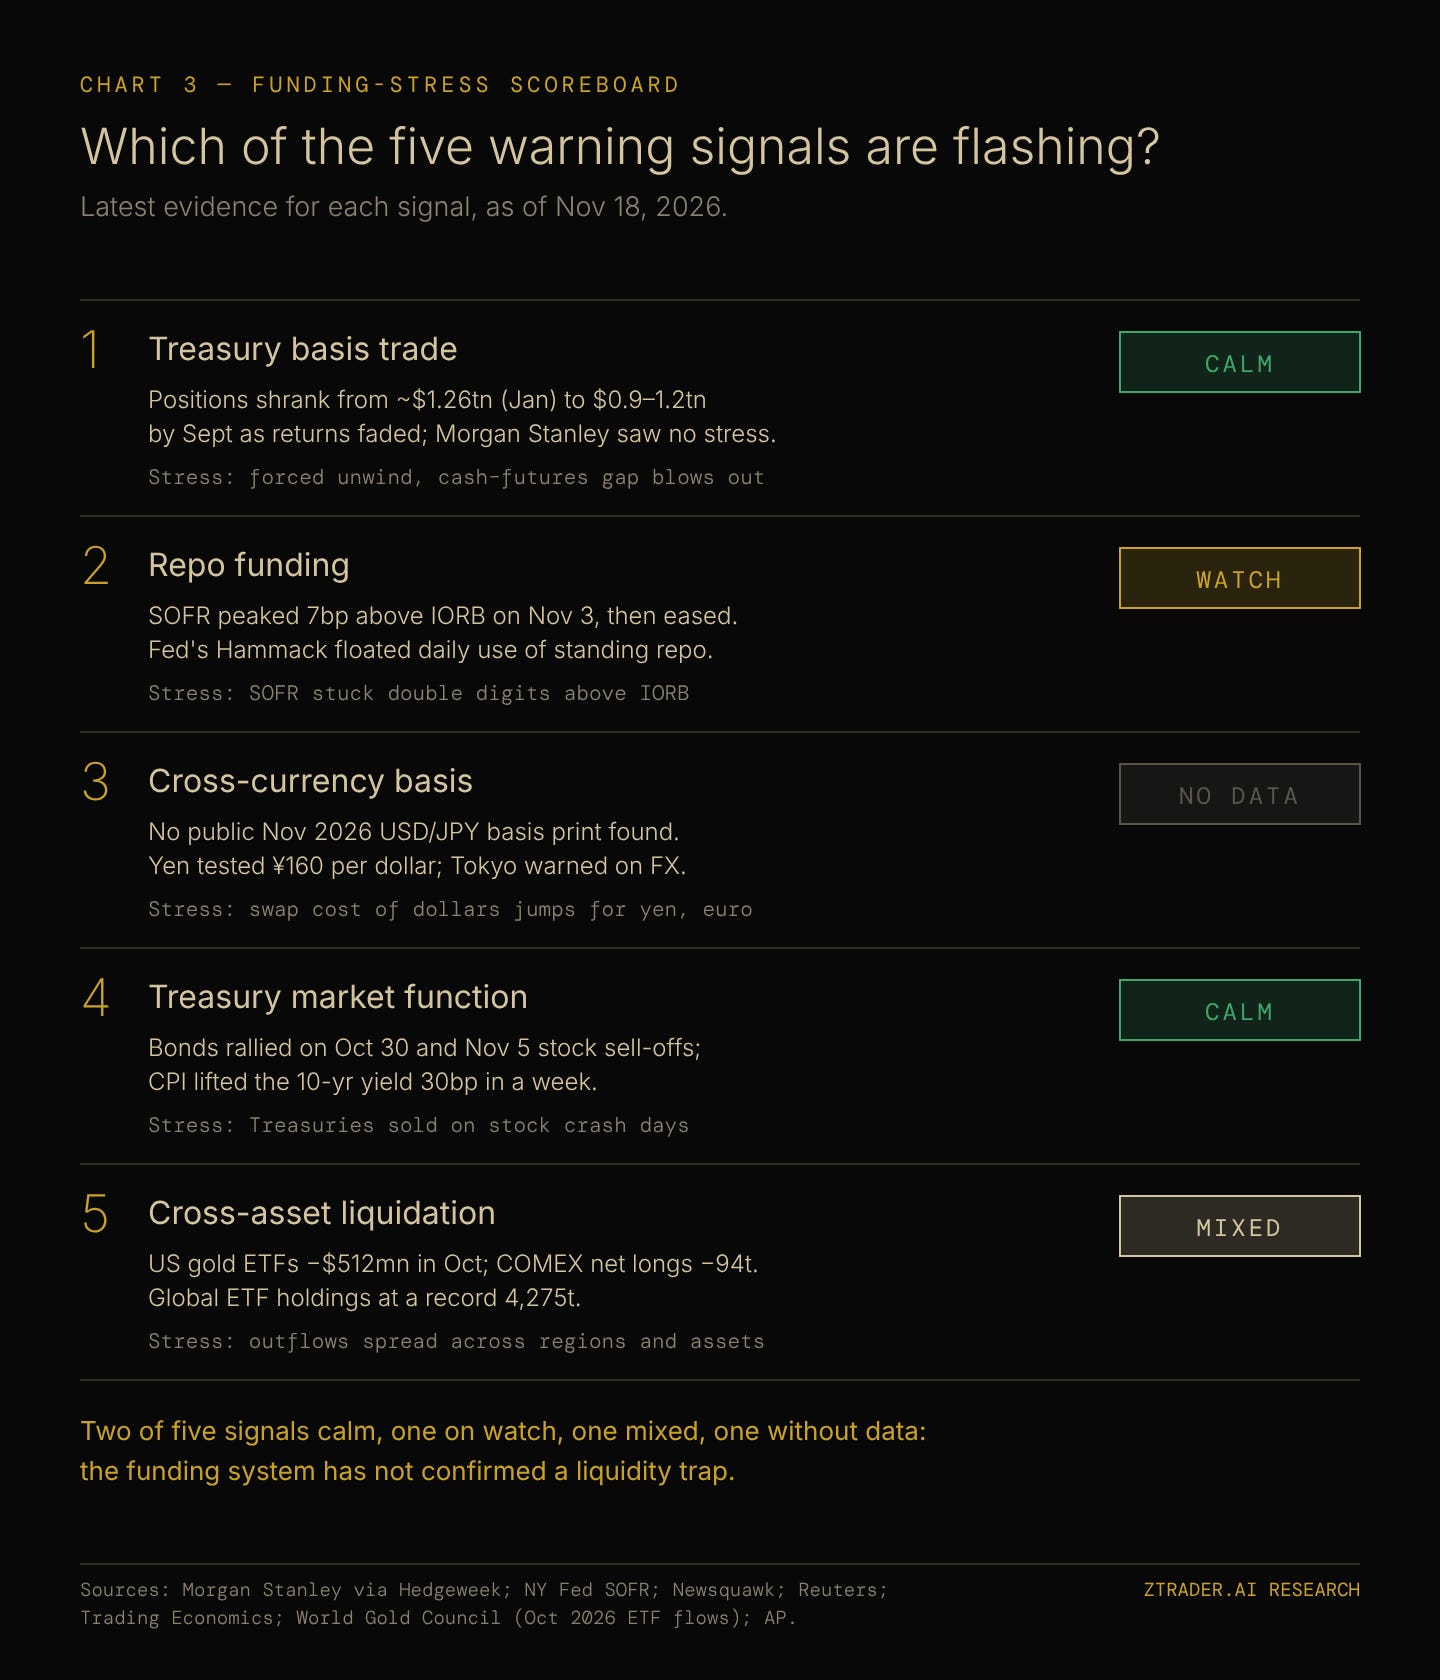
The funding system shows tight reserves and a strong dollar, yet none of its stress gauges has confirmed a liquidity trap.
VI. WHICH SIGNALS WOULD TURN A RATE SELL-OFF INTO A FUNDING CRISIS?
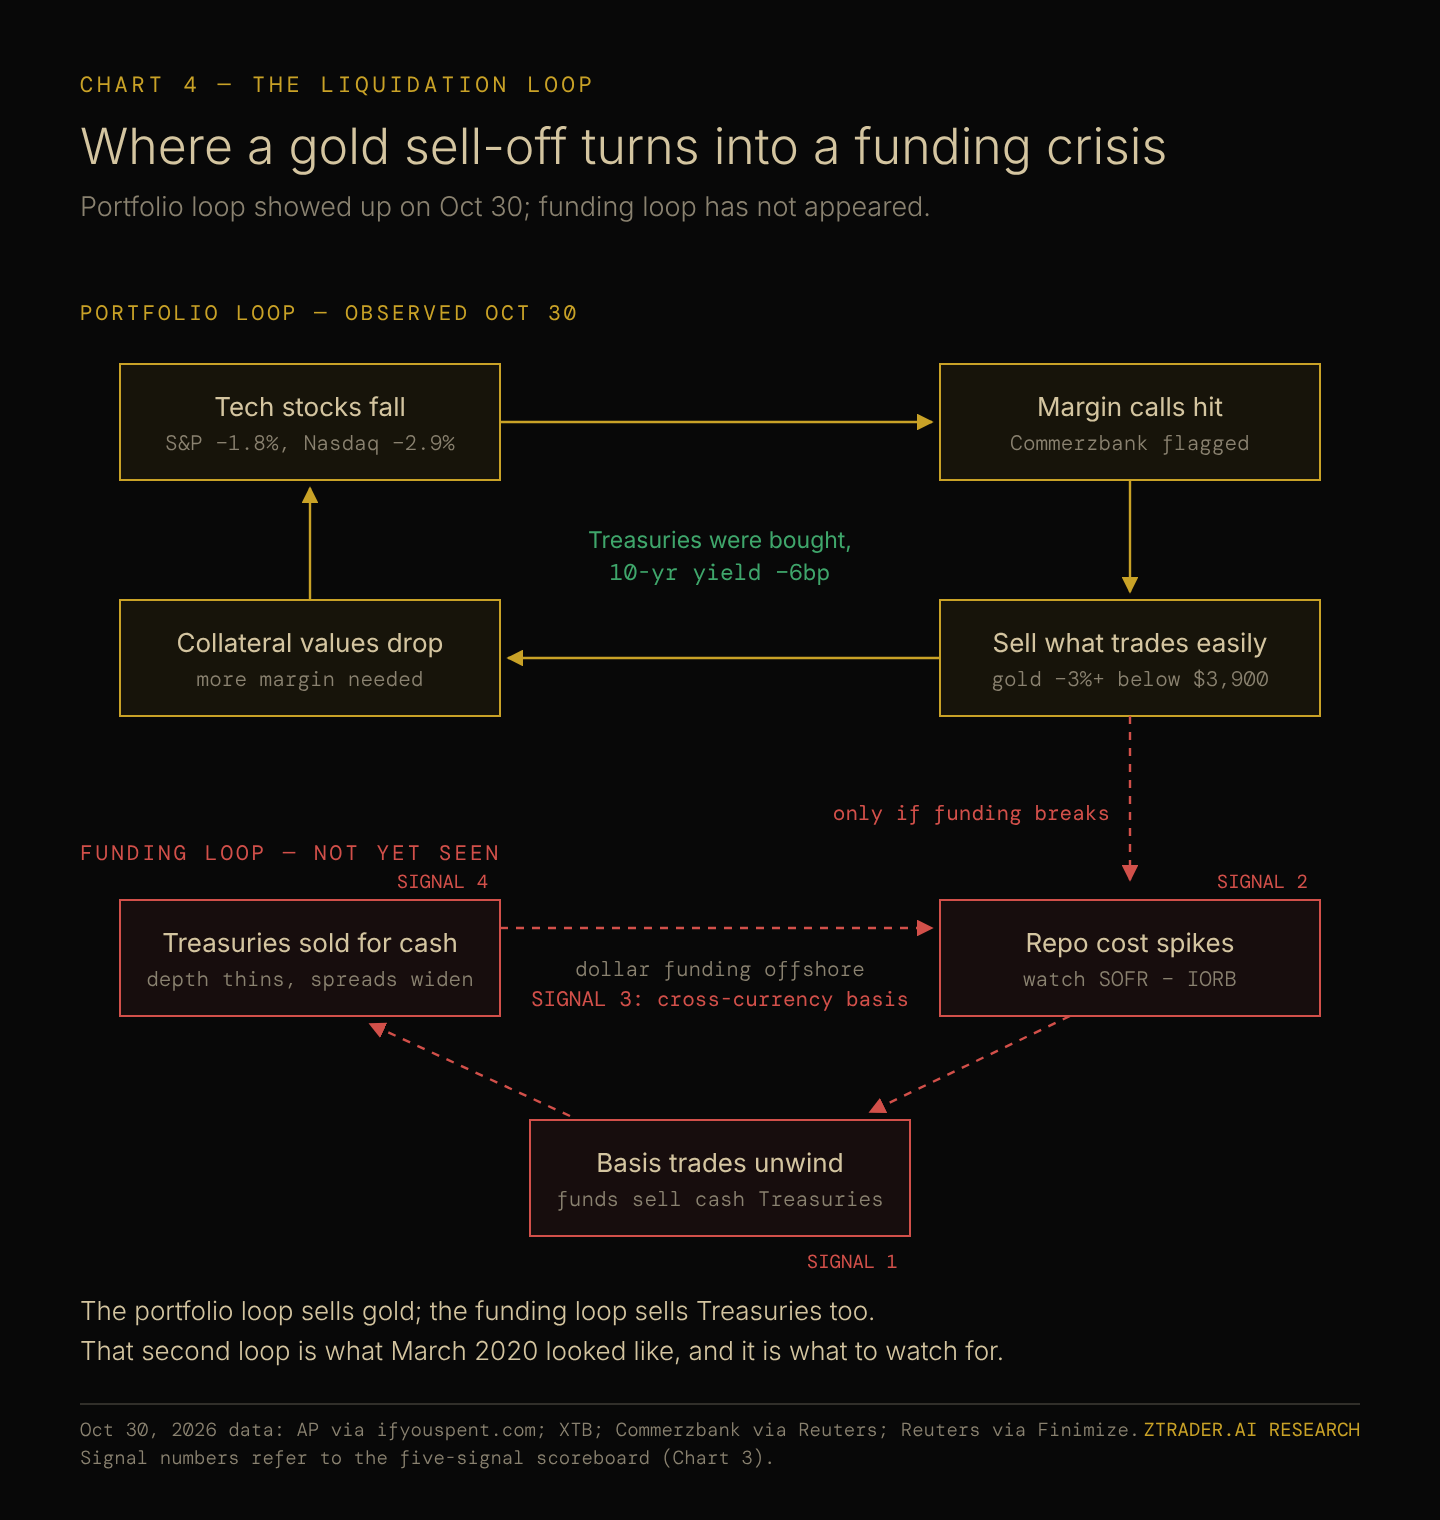
The October 30 sell-off showed the first half of a liquidation loop, and the second half is what traders need to watch.
The Portfolio Loop and the Funding Loop
In the portfolio loop, falling stocks trigger margin calls, investors sell what trades easily, gold drops, and lower collateral values demand more margin. That loop appeared on October 30, and it ended there because Treasuries rallied.
In the funding loop, repo costs spike, basis traders are forced to sell cash Treasuries, offshore borrowers scramble for dollars, and Treasury market depth thins until even the safest collateral is sold for cash. That second loop is what March 2020 looked like, and it has not appeared in 2026.
[CHART 4 — Where a gold sell-off turns into a funding crisis]
Five of the Most Important Indicators to Watch
1. Treasury basis: Positions that stop shrinking gradually and start unwinding under margin pressure, with cash and futures prices pulling apart.
2. Repo funding: SOFR holding double-digit spreads above IORB outside settlement dates, with heavy use of the Fed’s standing repo facility.
3. Cross-currency basis: Dollar funding through yen and euro swaps getting sharply more expensive.
4. Treasury market function: Treasury yields rising on days when stocks crash, the clearest sign that investors are selling bonds for cash.
5. Cross-asset liquidation: Gold ETF outflows spreading from the US to Europe and Asia while COMEX longs keep falling.
Gold becomes a funding-crisis story only when Treasuries start falling alongside stocks, and that tripwire remains untouched.
VII. WHEN DID GOLD BOTTOM UNDER VOLCKER, AND WHAT DOES IT MEAN NOW?
Gold’s 31.5% fall from its January record has a clear chain of causes.
Warsh’s nomination on January 30 broke the bet on a politically compliant Fed and knocked 8.5% off gold in one day.
The September 16 hike and a dot plot pointing to more hikes kept pressure on the metal. October’s hot CPI report then pushed traders to price a December hike, lifted the 10-year yield to 5.15%, held the 10-year real yield near 18-year highs and sent the dollar index to 103. Equity sell-offs added a layer of forced selling, visible in US ETF outflows and the October 30 drop, while the funding system has so far absorbed the stress without breaking.
The Volcker record supplies the rule for what comes next. In 1980, gold crashed on the expectation of tight money, ground lower while the Fed held rates near their highs, and bottomed in June 1982, one month before the Fed began cutting, after which it rallied 57%. Gold today is still in the pricing phase of that cycle, with the Fed’s December 8–9 meeting and the November CPI report on December 10 deciding whether traders keep adding hikes or start to see the last one.
