

By Dorian
I. Start from reading the BOFA’S CHART
The vertical line in Hartnett’s chart is being lifted by a Treasury selloff as much as by equities, and the low Chinese yields Trump envies are held in place by capital controls that Chinese savers are already queuing to get around.
[CHART 1 — US Stocks vs US Government Bonds and China Stocks vs China Government Bonds, Relative Prices, 2004–2026 (BofA Global Investment Strategy, Bloomberg)]
What the two lines really measure
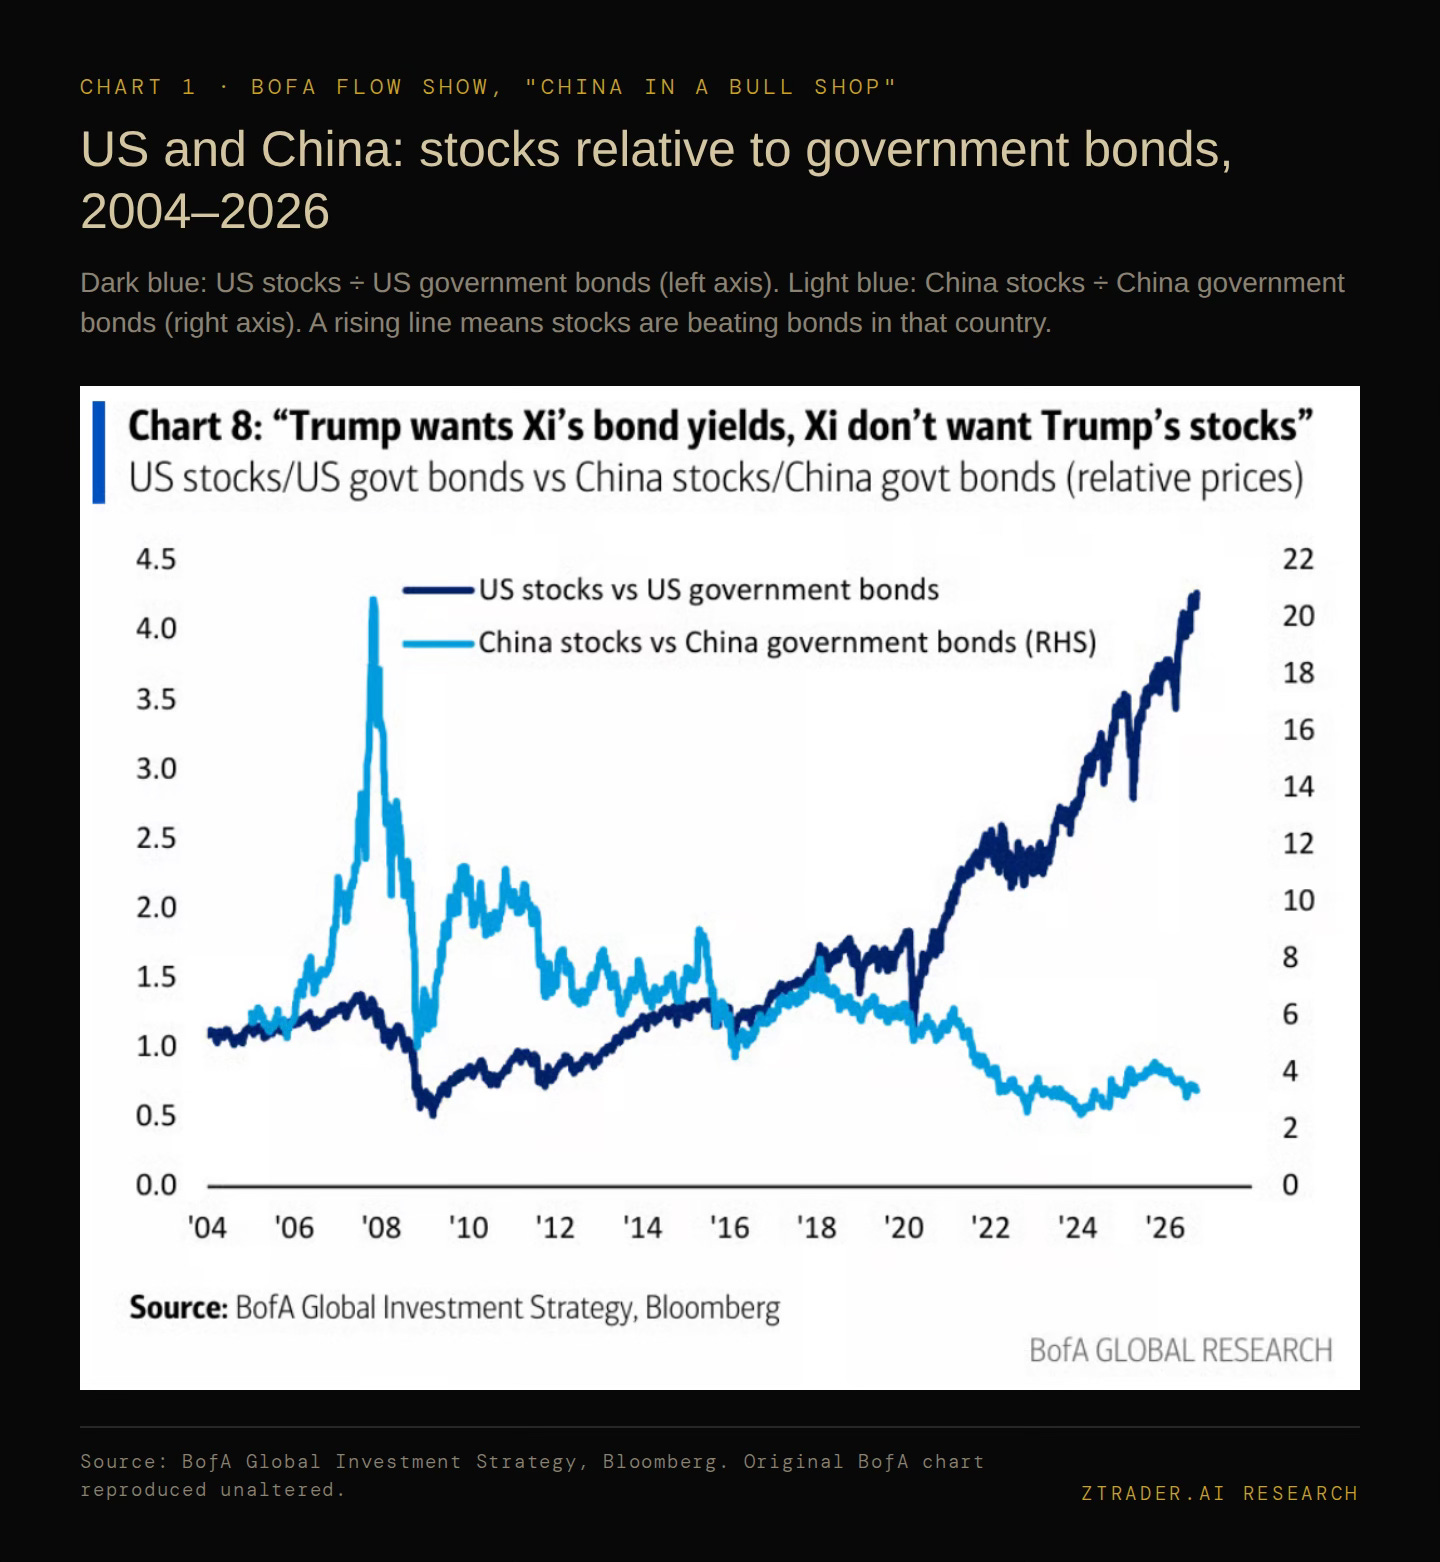
The Chart 8 in Michael Hartnett’s latest Flow Show, titled “China in a Bull Shop”, tracks two ratios over twenty-two years, and each one divides a country’s equity market by that same country’s government bond market, so a rising line means stocks are beating bonds at home and a falling line means bonds are winning.
The dark-blue line on the left axis is US stocks relative to US Treasuries, and the light-blue line on the right axis is Chinese stocks relative to Chinese government bonds, with the two scales set so that both lines begin at roughly the same point in 2004.
What twenty-two years of data show
The US line spent its first fifteen years going almost nowhere, falling to about 0.5 in the 2009 crisis, grinding back through the 2010s and only breaking above 1.5 around 2019, before turning close to vertical after 2023 and reaching roughly 4.3 today, meaning US equities have outperformed US government bonds more than fourfold since 2004.
The Chinese line tells the opposite story in reverse order, with its entire gain arriving early, when the 2006–07 A-share bubble drove it from about 5 to near 20 on the right axis, followed by a smaller rebound after the 2009 stimulus and a brief bump during the 2015 bubble, and then a long decline that has left it around 3, roughly 40% below where it started, so that a Chinese investor who simply held government bonds for two decades has done better than one who held the equity market.
The missing part of the chart
Hartnett draws conclusion as: “Trump would love Xi’s bond yields, but Xi don’t want Trump’s stock market.”
Even ZeroHedge’s accompanying text reads the chart the same way, describing US stocks relative to Treasuries as having gone vertical, and attributing the Chinese line’s slump to government bond yields held at the floor by a multi-year deflation that began with the 2021 housing bust.
The first half of that reading holds up only once the denominator is examined, but the second half no longer matches China’s data reality for 2026.
II. LET’S BREAKDOWN THE NUMBERS
The ratio rises when bonds fall
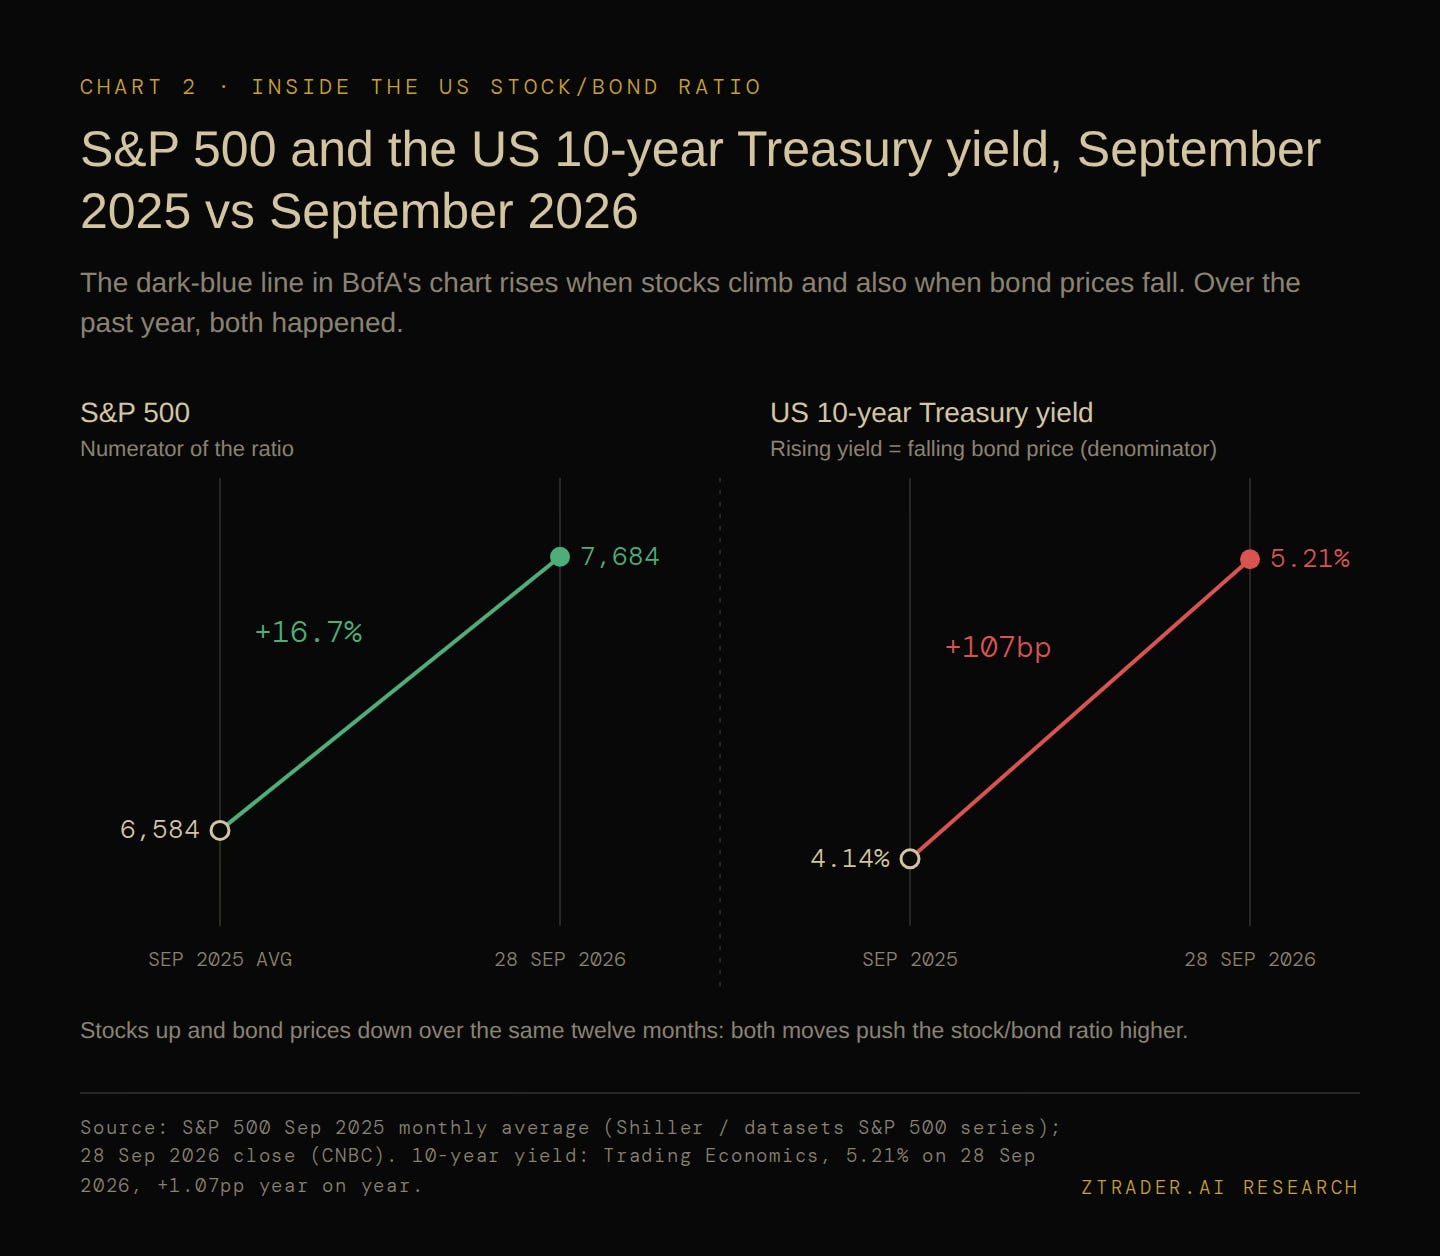
Because the dark-blue line is a ratio, it can climb for two separate reasons, and since 2023 it has been climbing for both at once.
The S&P 500 closed Monday at 7,683.69, a few percent below its highs, while the 10-year Treasury yield rose 6 basis points to 5.24%, its highest level since 2007, and the 30-year reached 5.56%, a level last printed in 2004.
With the index near record territory and the long bond at its lowest price in almost two decades, the ratio is being pushed up from the numerator and pulled up from the denominator at the same time, and the near-vertical slope on the right edge of the chart, which takes the line to roughly 4.3 times its 2004 starting value, carries both forces inside it.
[CHART 2 — US 10-Year Treasury Yield vs S&P 500, 2026]
The denominator has done a lot of the work in the last month alone.
By Hartnett’s own count, the four weeks since the end of August delivered one Fed hike and a 60 basis point rise in the 10-year yield, and money markets now put the odds of another 25 basis point hike in October at around 70%, with swaps pricing three more quarter-point increases over the following year.
A stock-to-bond ratio that goes vertical during a hiking cycle is recording a bond selloff as much as an equity rally.
Why this rally does not show reality?
When the ratio rises because earnings are growing faster than bond prices, the equity side keeps its cushion.
When the ratio rises because bond prices are collapsing underneath stable equity prices, the cushion shrinks with every basis point, and State Street’s mid-September read was that the equity risk premium had already compressed to its lows as Treasury yields approached 5%, leaving bonds significantly more competitive with stocks than at any point in the post-crisis era.
That is why Hartnett’s trigger for a genuine risk-off move sits in the denominator.
His condition is a further $10 drop in oil alongside yields that keep rising, a combination that would show the Treasury selloff is being driven by supply and term premium rather than by the Iran-war oil shock, which would remove the one explanation that could reverse on its own.
The supply side is already visible: last Thursday the Treasury bought back only $4.078 billion of 20- and 30-year bonds, against $10.47 billion offered and a planned $6 billion, the same week a 5-year auction drew unexpectedly weak demand.
III. CHINA’S 1.68% IN A YEAR OF 3.8% PRODUCER INFLATION
The deflation explanation belongs to 2025
The accompanying ZeroHedge text explains the light-blue line by pointing to Chinese yields pinned at the floor by a multi-year deflationary collapse that began with the 2021 housing bust.
That description fit the data through the start of this year, when producer prices were still falling on an annual basis for a 40th straight month, following a 2.6% contraction across all of 2025.
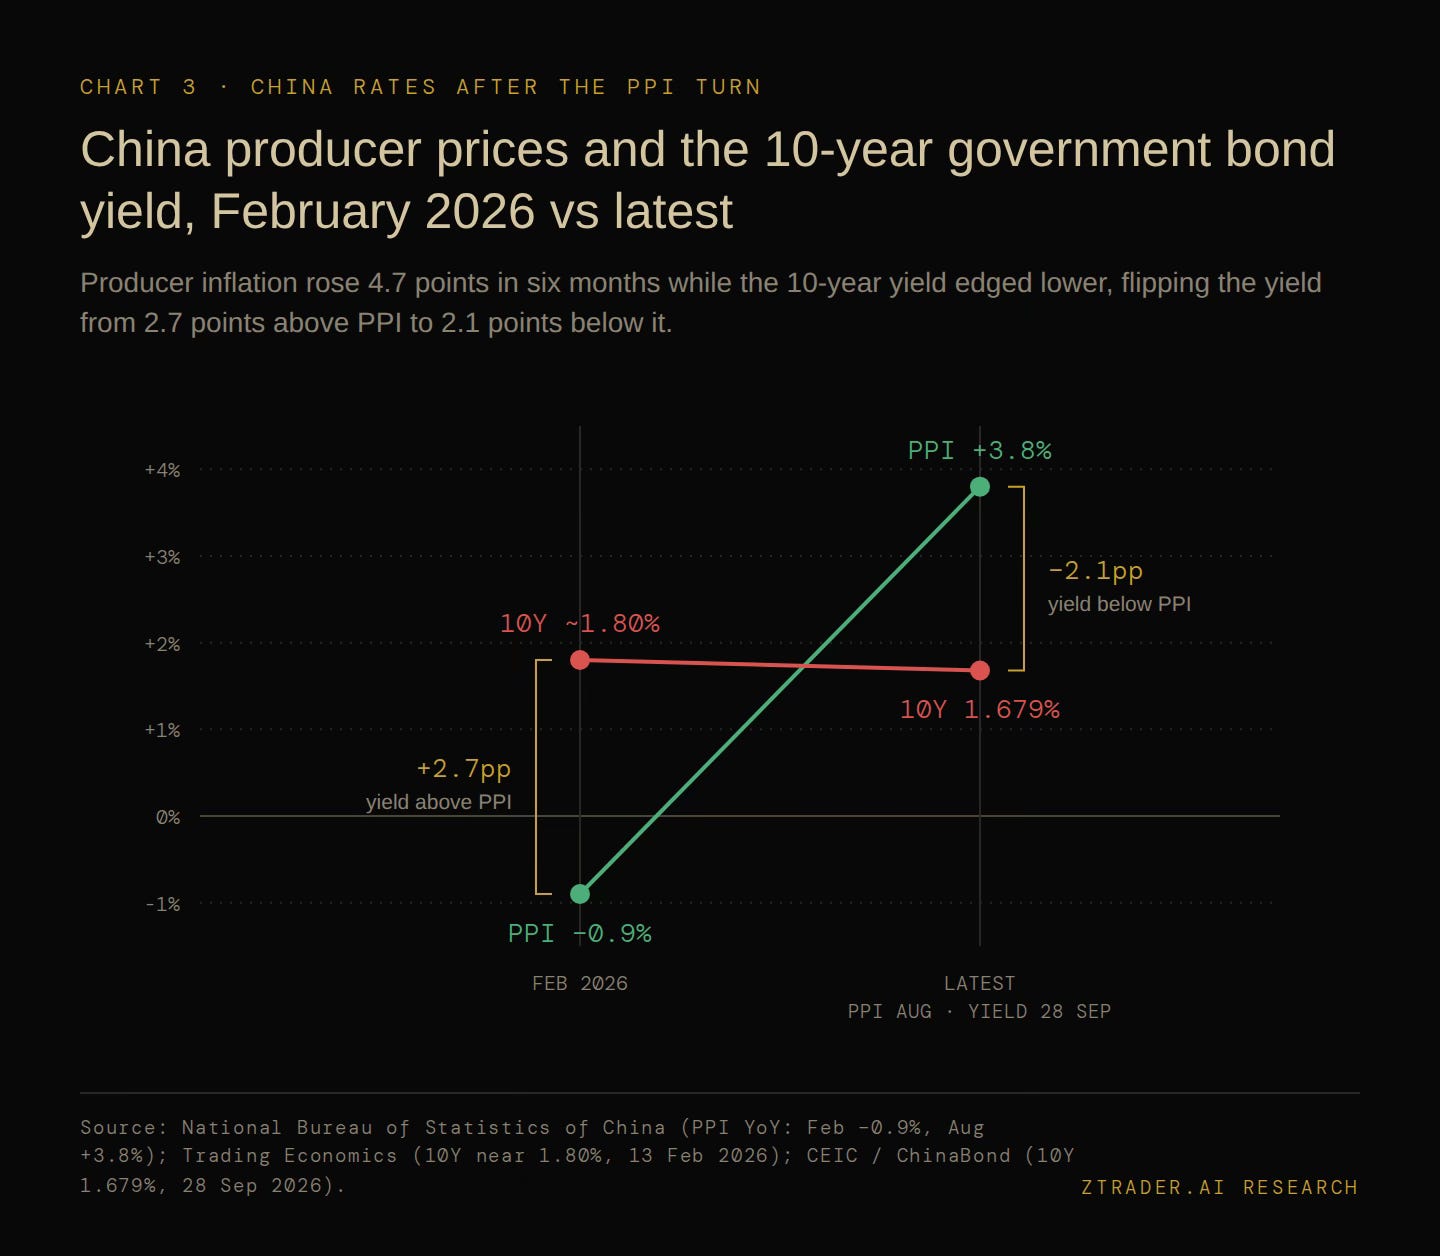
The data changed in the spring and the yield did not follow. Producer prices were down 0.9% year on year in February and up 3.8% in August, ahead of a 3.7% consensus, while consumer prices rose 0.8% and industrial profits grew 15.7% over the first eight months of the year.
Over the same stretch the 10-year Chinese government bond yield went the other way, finishing September 28 at 1.679%, less than 9 basis points above its all-time low of 1.596% set in February 2025.
[CHART 3 — China 10-Year Government Bond Yield vs PPI YoY]
What the real-rate arithmetic shows
This read is measured against consumer inflation, the Chinese 10-year still offers a real yield of roughly 0.9%, but measured against producer inflation the real yield is about minus 2.1%, and a government bond that pays two points less than factory-gate inflation while industrial profits grow in the mid-teens is being priced by something other than a deflation outlook.
The more consistent explanation is a large pool of domestic savings with limited places to go, meaning the the majority of saving is FROZED in the Chinese economy which was held in place by capital controls and by a banking system that has been a structural buyer of duration, to the point that Reuters reported in mid-September that the PBOC is preparing new metrics to limit banks’ holdings of long-dated bonds.
Why the PPI turn has not reached A-shares
The source of the producer-price rebound explains why Chinese equities have not rerated with it.
The statistics bureau pointed to firmer energy prices, transport costs within the consumer basket rose 2.5% on fuel, and with Brent holding around $105 a barrel the increase in upstream prices functions as an import-cost squeeze on downstream manufacturers rather than a signal of stronger domestic demand.
The CSI 300 is down 4.46% over the past twelve months, and after the Trump-Xi summit ended with a truce extension to January 10 but no progress on AI, the Iran war or Taiwan, the Shenzhen Component fell 2.1% to a near two-month low on the first session back from the holiday.
On BofA’s right-hand axis the light-blue line now sits around 3, roughly 40% below where it started in 2004.
IV. QDII QUOTAS & 24% PREMIUM ON THE NASDAQ
Xi’s preference and his savers’ preference
Hartnett’s line has Xi declining Trump’s stock market, and at the level of state policy that is accurate, but the latest outbound flow data shows Chinese households and institutions buying as much of it as Beijing will allow.
Hartnett is undoubtedly a top macro strategist in the West, but he may be misjudging the baseline openness and quality of the Chinese economy.
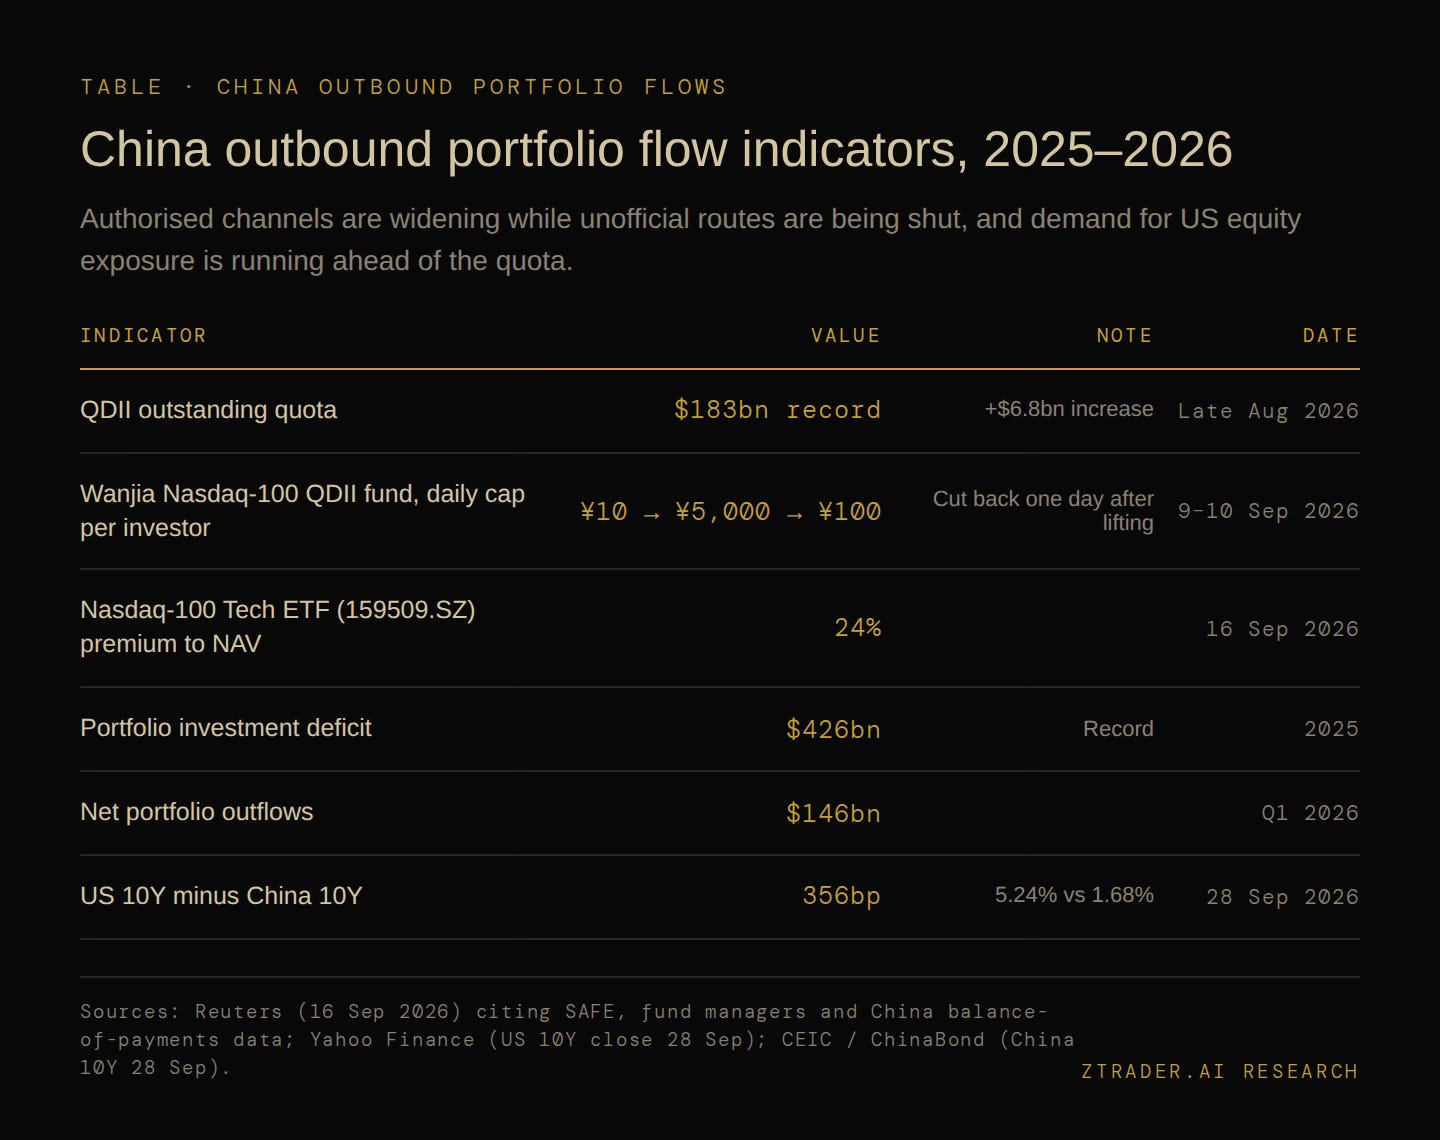
In late August the foreign exchange regulator raised the outstanding QDII quota by $6.8 billion to a record $183 billion, and on September 9 a QDII fund tracking the Nasdaq-100 lifted its daily subscription cap from 10 yuan to 5,000 yuan, only for its manager, Wanjia Asset Management, to cut it back to 100 yuan per investor a day later after what one fund consultant described as explosive inflows.
The Shenzhen-listed ETF tracking the Nasdaq-100 Technology Sector index traded at a 24% premium to its net asset value the following week.
[TABLE — China Outbound Portfolio Flow Indicators, 2025–2026]
These flows sit on top of an outflow trend that was already at record size.
China’s portfolio investment deficit reached $426 billion in 2025, and net outflows were $146 billion in the first quarter of this year, while Beijing has been closing unofficial routes such as overseas online brokerages at the same time as it widens the authorized ones.
The capital account holds the floor under the yield
China’s 10-year can sit about 356 basis points below the US 10-year because the capital account restricts who is able to arbitrage that gap.
For every quota increase is a controlled release of that pressure, and the 24% ETF premium is a direct measure of how much pressure remains behind it.
If the channel widens far enough, savings that currently buy Chinese government bonds at 1.68% gain access to 5.24% in Treasuries and to the US equity market that has outperformed its own bonds more than fourfold since 2004, and the domestic bid that keeps Chinese yields at the floor becomes harder to sustain.
That tension explains why the same regulator that raised the quota is also cracking down on every channel it does not control.
What this means for the dark-blue line
For anyone holding US equities, the relevant conclusion is that part of the current bid under US technology stocks comes from a capital pool whose size is set administratively in Beijing.
One shocking example(which will illuminates on the V chapter):
The Wanjia fund was almost liquidated, it went from 5,000-yuan cap to a 100-yuan cap in a single day, which shows how quickly that source of demand can be throttled, and it arrives at a moment when the valuation support described in Section II is already thin.
The market rally that leans on a compressed equity risk premium at home and on quota-dependent inflows from abroad is carrying more policy risk on both sides of the Pacific than the vertical line on BofA’s chart suggests.
V. THE 100-YUAN CAP WANJIA FUND
This fund is built for pocket change, allowing Chinese retail investors to deploy spare money—which is why it serves as such a unique underlying asset for probing real consumption power and behavior.
Operating as an off-exchange index product aimed at small-ticket savers, every aspect of its design exposes the true pulse of grassroots liquidity.
It is bought through the same consumer apps households use for payments and idle cash, including Alipay and Wanjia's own app, where the manager offers a fee discount for switching money straight out of its "super wallet" money-market account into the fund.
Its caps are set per account per day, and for the two months before September the ceiling was 10 yuan, which turned the product into a daily drip of loose change with no room to move savings in size.
At its mid-2024 report date, according to data compiled by Lixinger, individual investors held about 87% of the fund's shares across roughly 75,000 accounts, an average of around 5,000 shares each.
When the cap briefly rose to 5,000 yuan, the flood that forced it back down within a day was necessarily built from tickets of 5,000 yuan or less per account, and Chinese financial press describes investors responding to the caps by spreading a few yuan a day across several restricted QDII funds at once, a habit they call "opening a supermarket".
On the latest reported figures, assets across the A and C share classes come to roughly 1.2 billion yuan, so the explosive inflows Reuters described were explosive relative to a small fund fed by small accounts.
So Who stands behind the fund
Wanjia Asset Management is owned entirely by Shandong provincial state capital. Zhongtai Securities raised its stake to 60% in early 2023, after regulators approved Shandong Energy Group, which is controlled by the Shandong provincial state assets commission, as Wanjia's actual controller, and the remaining 40% has been held since 2021 by Shandong New Momentum Fund Management, identified in the financial press at the time as controlled by the provincial finance department.
The Nasdaq-100 index QDII fund at the centre of the September episode is therefore a product of a provincial state-owned manager, and that manager decides, day by day, how much of their savings Chinese households can move into US technology stocks through it.
Wanjia's is the classic China Consumption Power example
By early June, according to Chinese financial press, 164 of the roughly 330 QDII products on the market had either suspended subscriptions or imposed limits on large orders, and in late February two popular QDII funds loosened their caps and tightened them again within a day, one of them cutting its limit from 3 million yuan to 1,000 yuan.
What sets the Wanjia case apart is the size of the swing and the owner behind it.
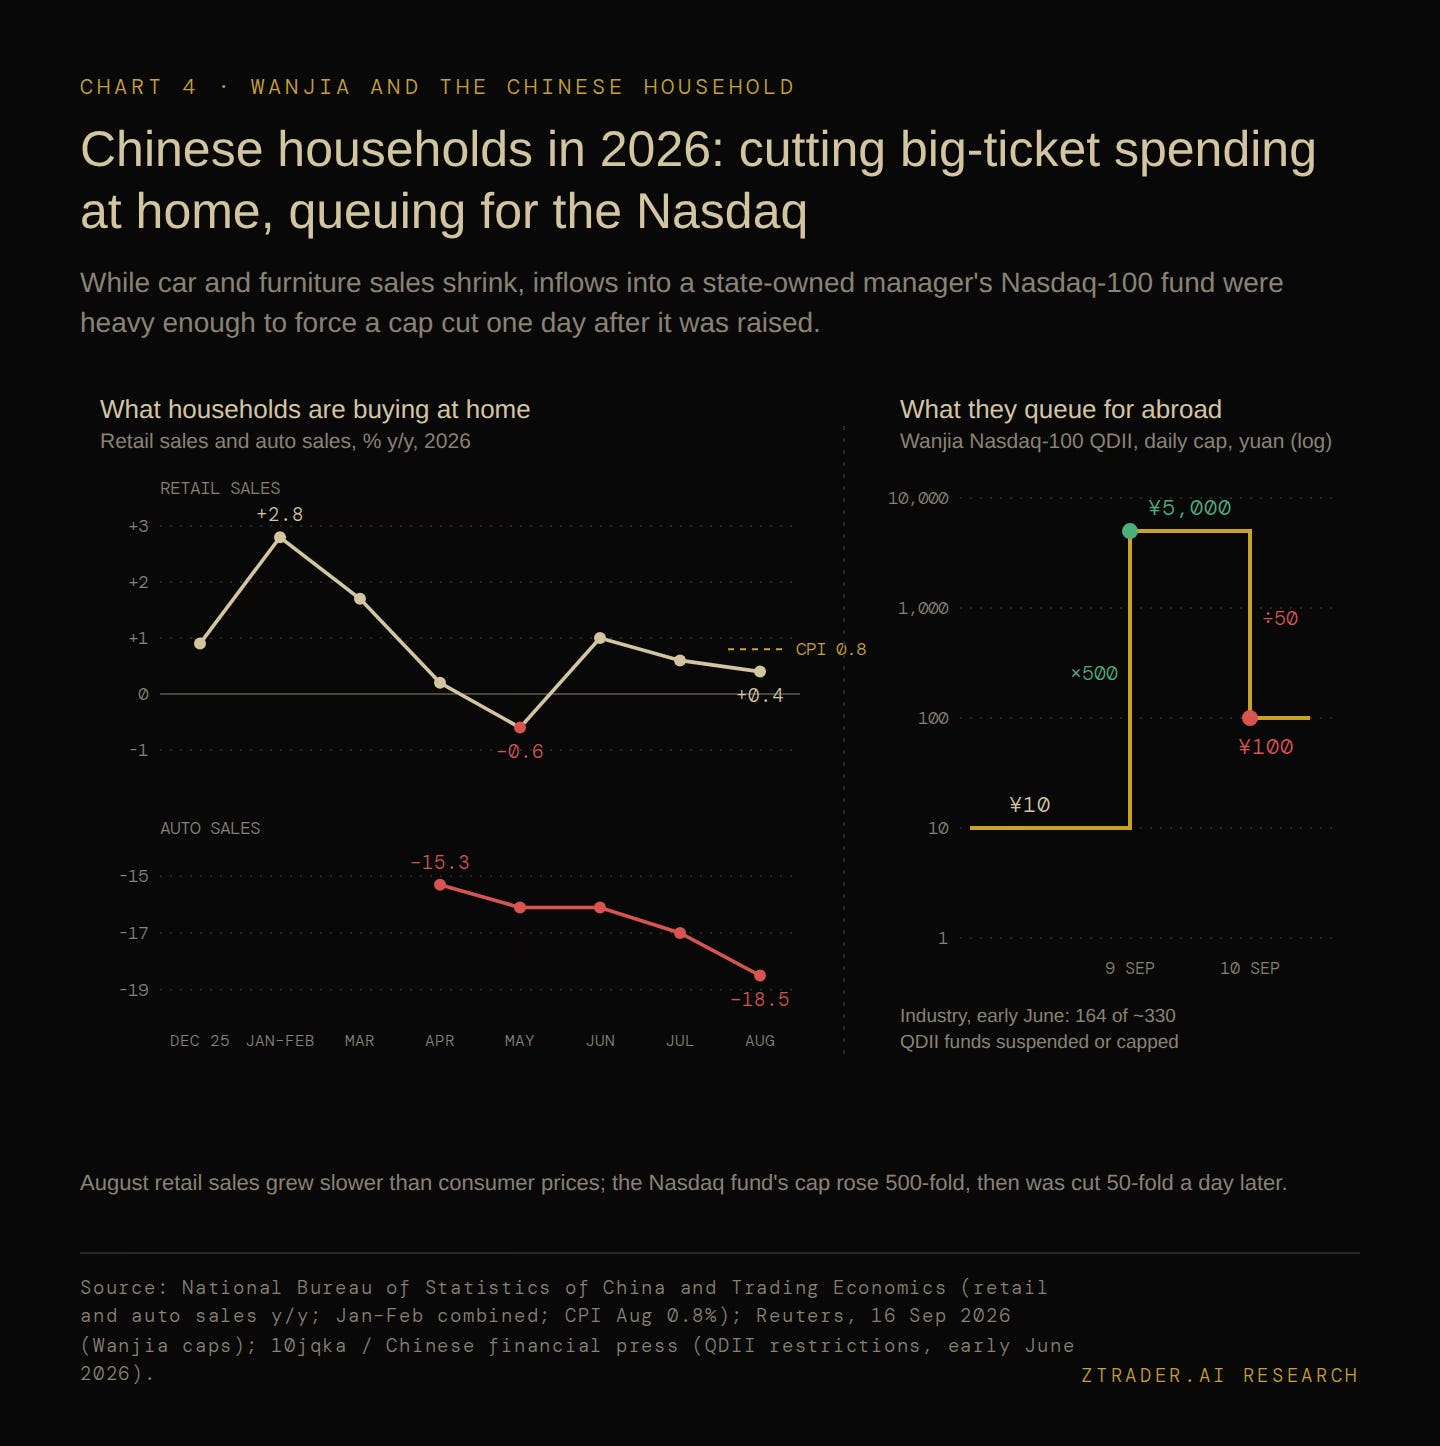
The fund raised its daily cap from 10 yuan to 5,000 yuan on 9 September, a 500-fold widening, and cut it to 100 yuan the next day because inflows had been, in one consultant's word, explosive, leaving the cap ten times above where it started and still too small to matter to any individual household.
[CHART 4 — China Retail Sales and Auto Sales in 2026, and Wanjia's Nasdaq-100 QDII Daily Cap, 9–10 September]
What the same households are not buying at home
The households that absorbed Wanjia's allocation in a day are pulling back from the purchases that drive domestic demand.
Retail sales rose 0.4% year on year in August, below the 0.8% consumer inflation rate for the month, after falling 0.6% in May for the first decline since December 2022, and automobile sales fell 18.5% in August after double-digit declines in every month since April, with furniture and building materials also contracting.
The statistics bureau itself described the domestic imbalance between strong supply and weak demand as pronounced.
Part of the QDII rush is return-chasing after a year in which the Nasdaq-100 held its strength and Korean chip stocks more than doubled, and the rest points in the same direction as the retail data: savings that could fund a car, a renovation or a domestic bond at 1.68% are queuing for a 100-yuan daily slice of the Nasdaq, and the state-owned managers holding the gate can widen or narrow that slice overnight.
VI. THE HIDDEN PRICE TAG ON XI'S 1.68% YIELD
Here’s the missing part of the chart:
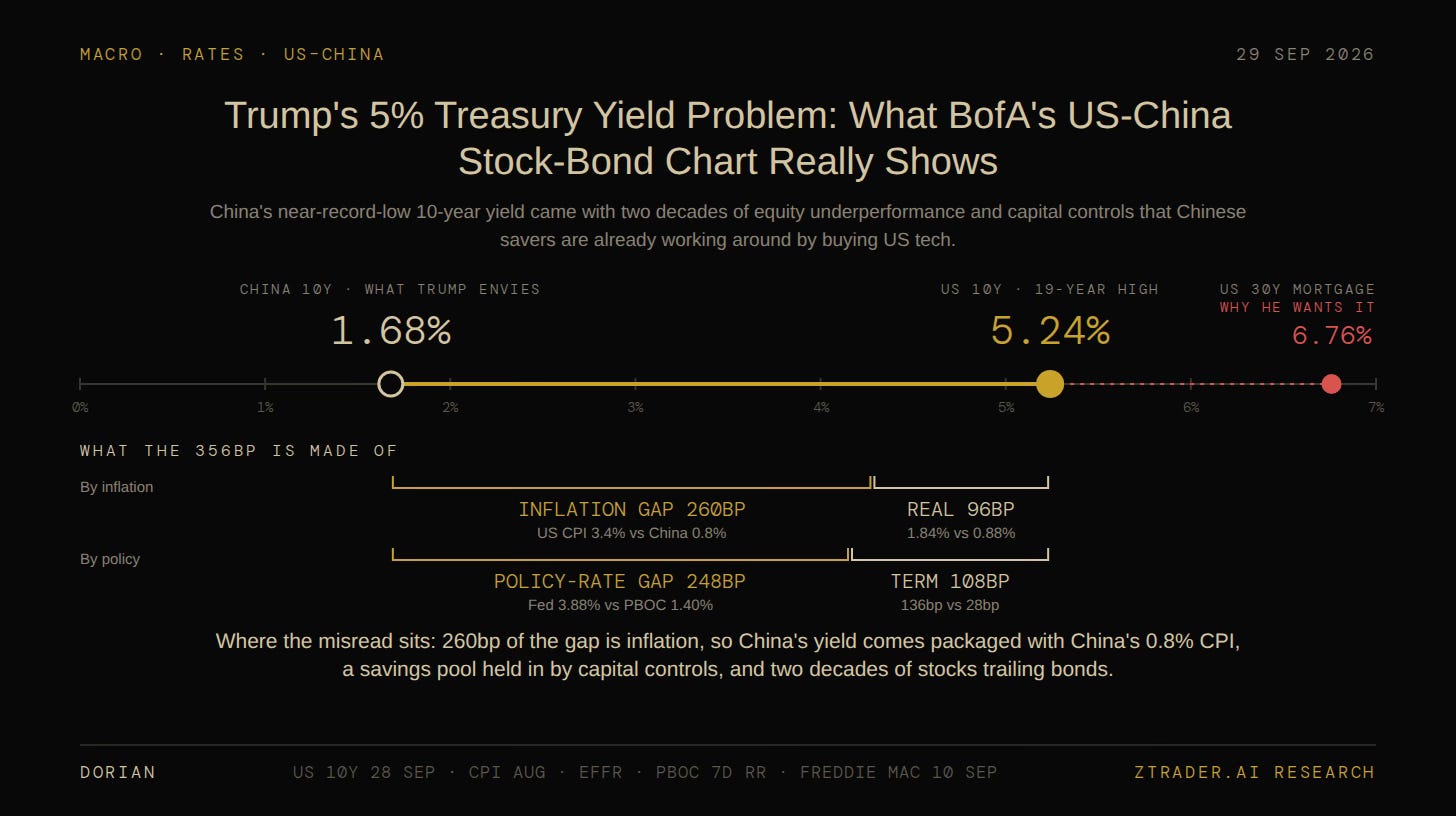
Hartnett frames the two markets as a swap each leader would like to make, and on the numbers behind Chart 8, Trump would be taking China's demand problem along with China's yield.
Of the 356 basis points separating the two 10-year yields, 260 come from the gap between 3.4% US inflation and 0.8% Chinese inflation, which means the 1.68% Trump envies is priced on households that cut car purchases by 18.5% in August, keep their savings inside a closed capital account, and pay a 24% premium for the right to put 100 yuan a day into the Nasdaq.
China reached its low yields by keeping those savings at home, and the cost was two decades in which Chinese stocks trailed Chinese government bonds.
Therefore, a US 10-year at Chinese levels would have to arrive the same way, through weaker demand and far lower inflation, and for Trump the only useful reading is this: