

By Dorian
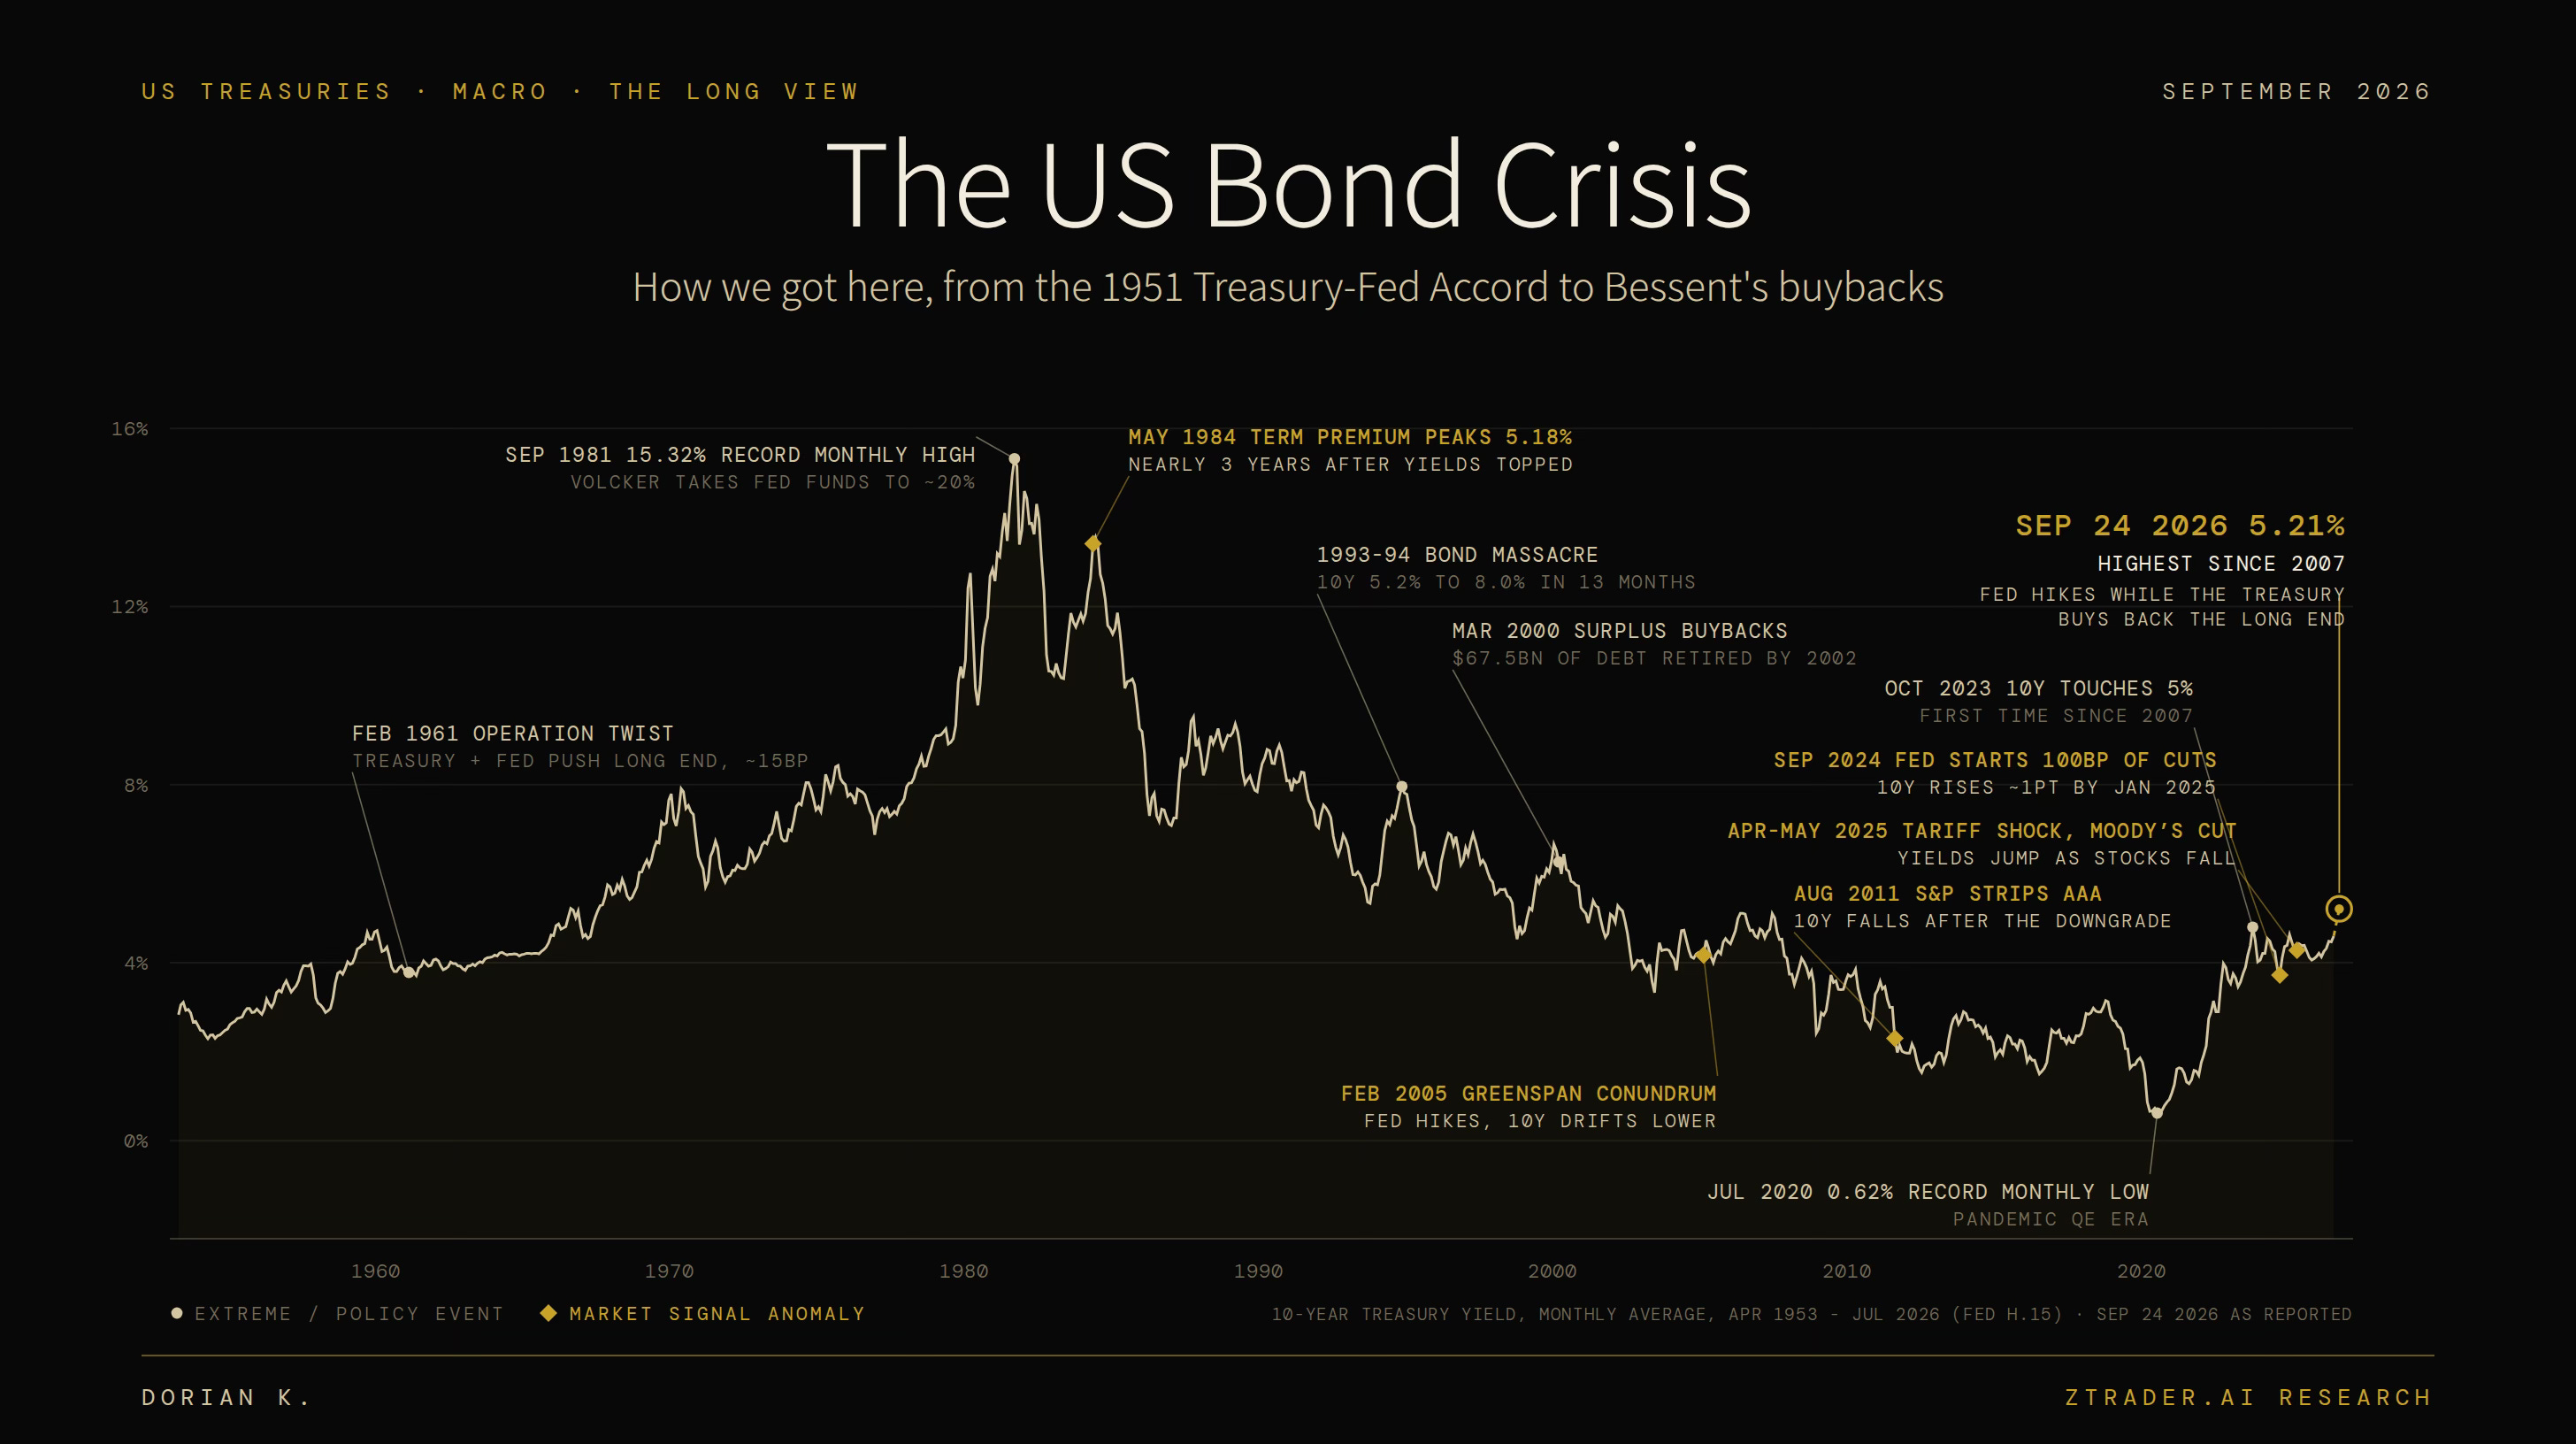
The cover traces the monthly average yield on the 10-year US Treasury from April 1953 to July 2026, extended to the reported level of 5.21 percent on September 24, 2026, the highest since 2007.
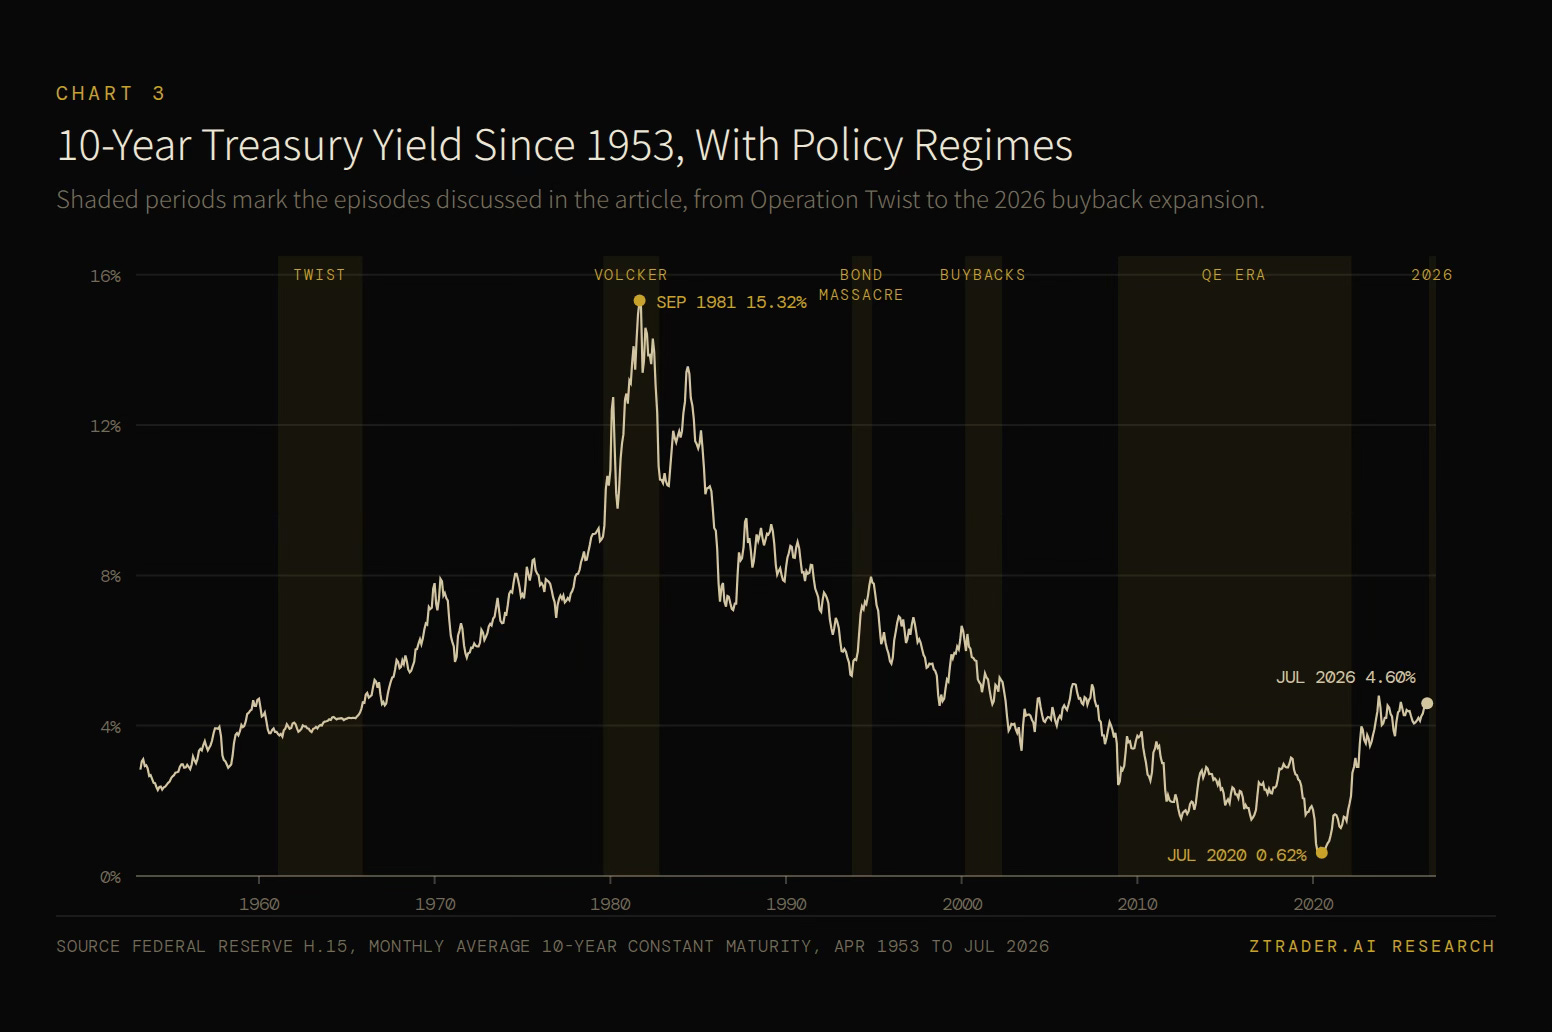
The line climbs from under 3 percent in the 1950s to a record monthly high of 15.32 percent in September 1981, when Paul Volcker had taken the federal funds rate to about 20 percent, then falls for nearly four decades to a record monthly low of 0.62 percent in July 2020 during the pandemic QE era, before rising steeply again.
Cream dots mark the extremes and policy events along the way: Operation Twist in 1961, the 1993–94 bond massacre that took the 10-year from 5.2 to 8.0 percent in thirteen months, the surplus-funded buybacks that began in March 2000, and the 10-year touching 5 percent in October 2023.
Gold diamonds mark moments when the bond market moved against the expected signal:
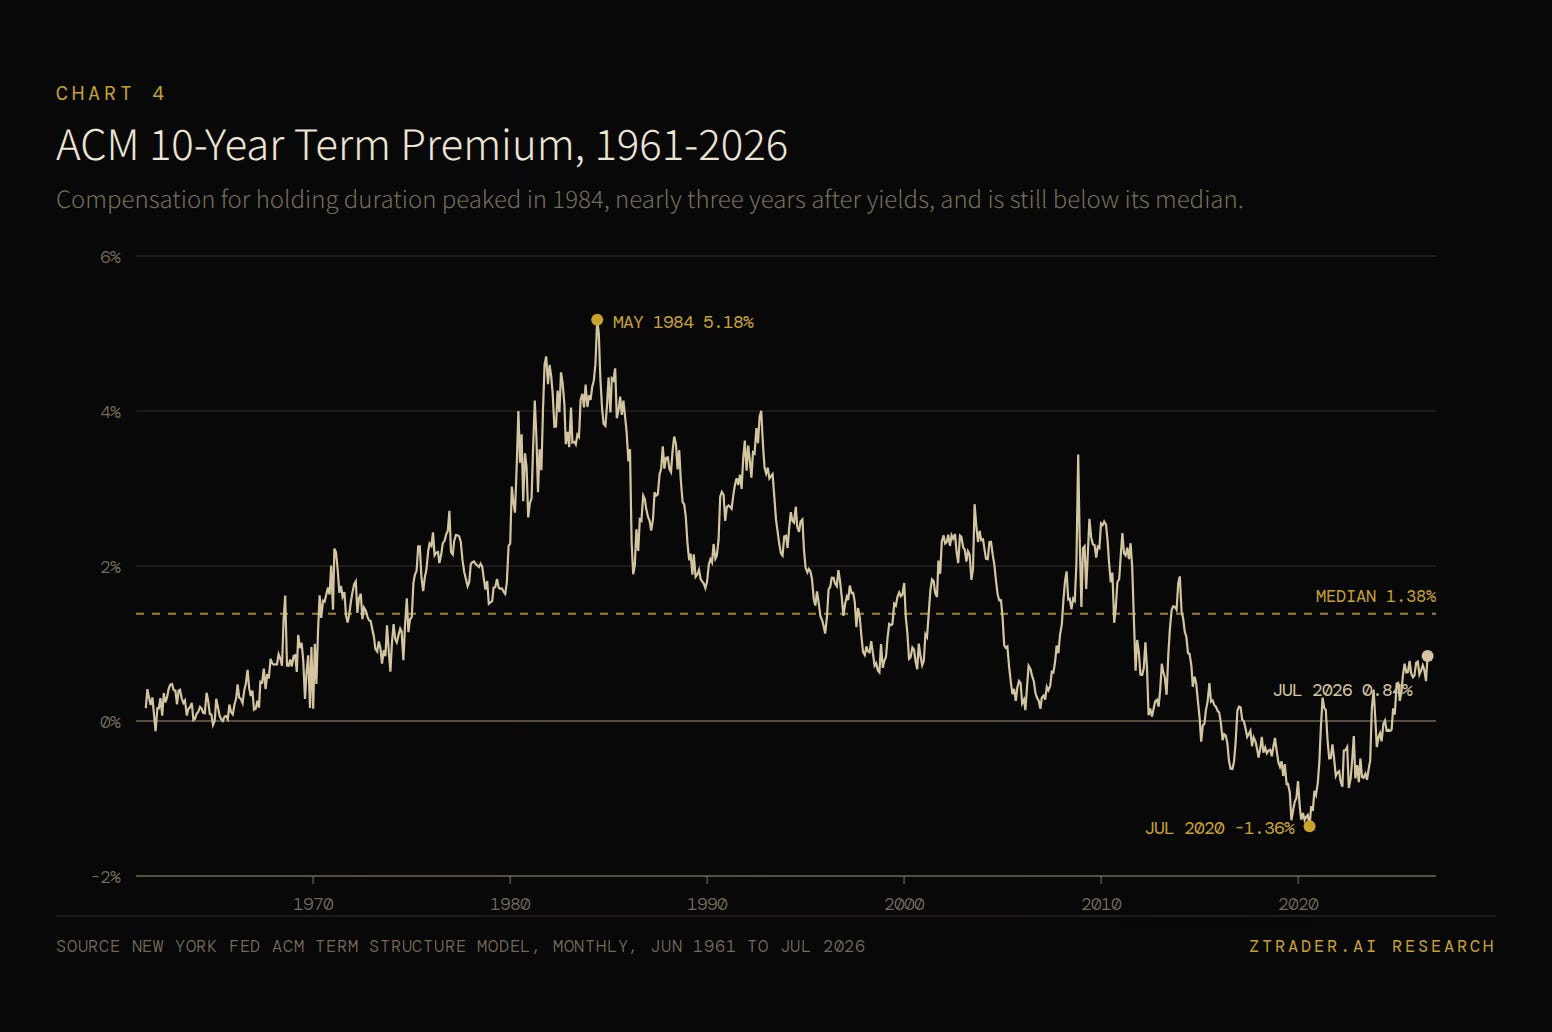
The term premium peaking at 5.18 percent in May 1984, nearly three years after yields had topped;
Greenspan’s 2005 conundrum, when the Fed hiked and the 10-year drifted lower;
The fall in yields after S&P removed the US AAA rating in August 2011;
The roughly one-point rise in the 10-year after the Fed began 100 basis points of cuts in September 2024; and the tariff shock of April and May 2025, when yields jumped as stocks fell and Moody’s removed the last AAA rating.
The line ends with September 2026, when the Federal Reserve was raising rates while the Treasury was buying back long-dated debt.
Treasury yields at their highest since 2007 are pricing a contest between the Treasury and the Federal Reserve over who sets the price of long-term American debt, and eighty years of bond market history show how that contest usually ends.
By Dorian
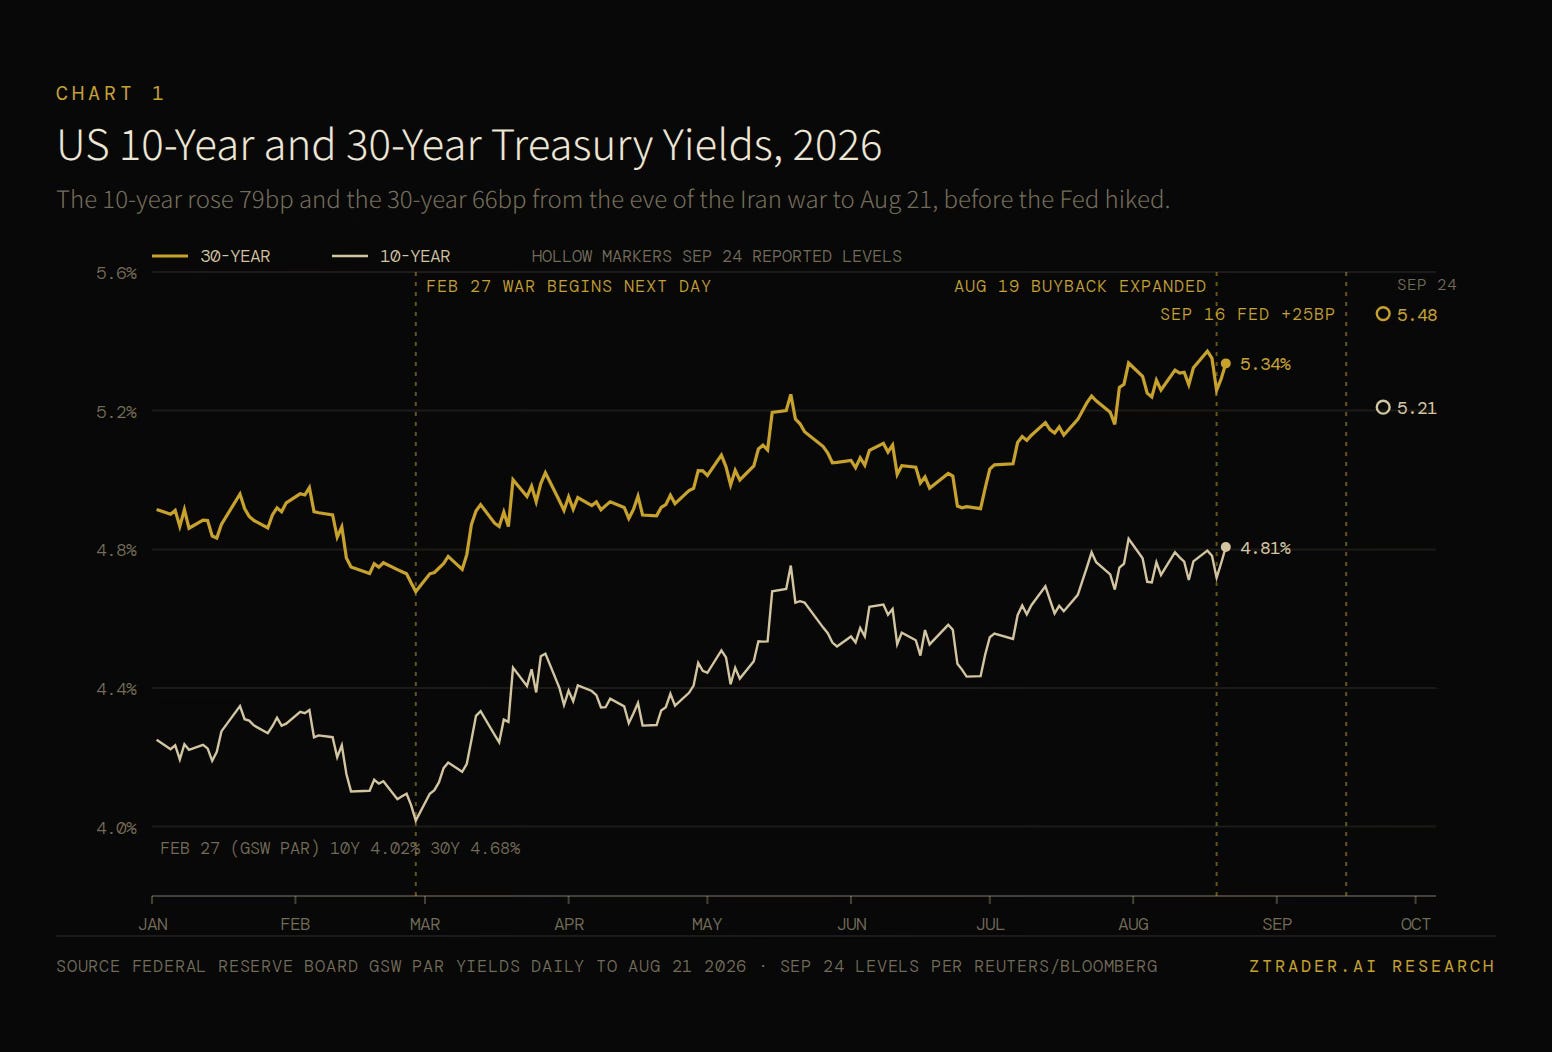
On Thursday, September 24, the 30-year Treasury yield rose to 5.48 percent, its highest level since 2004, and the 10-year reached 5.21 percent, a level last seen in the summer of 2007. Eight days earlier the Federal Reserve had raised rates for the first time since July 2023, and five weeks earlier the Treasury had doubled the size of its long-dated buyback operations in an openly stated effort to bring long-term borrowing costs down.
The central bank was tightening at the front of the curve while the finance ministry was trying to hold down the back of it, and in the space of a single month both of those policies were running at once in the world’s largest government bond market.
Most of what is being written about the “US bond crisis” treats it as a story about debt levels and a looming buyers’ strike, while the data point to something more specific and more historically familiar, which is that collision between the two institutions.
I. WHERE TREASURY YIELDS STAND IN SEPTEMBER 2026
The move since February 27
The 10-year Treasury closed at 3.96 percent on February 27, the last trading day before the United States and Israel went to war with Iran. Oil moved above $100 a barrel as the Strait of Hormuz closed, the Bloomberg Commodity Index gained more than 30 percent in the year to date with diesel up 83 percent, and headline CPI climbed to 3.4 percent in August, and the PCE price index rose 3.7 percent in the year to July with the core measure at 3.3 percent.
On September 16 the Federal Open Market Committee voted 12 to 0 to raise the federal funds range by 25 basis points to 3.75–4.00 percent, and a 2-year yield of 4.90 percent a week later implies further hikes beyond the one the committee’s own projections imply for the rest of this year.
[CHART 1 — US 10-Year and 30-Year Treasury Yields, 2026]
Decomposing the 125 basis points
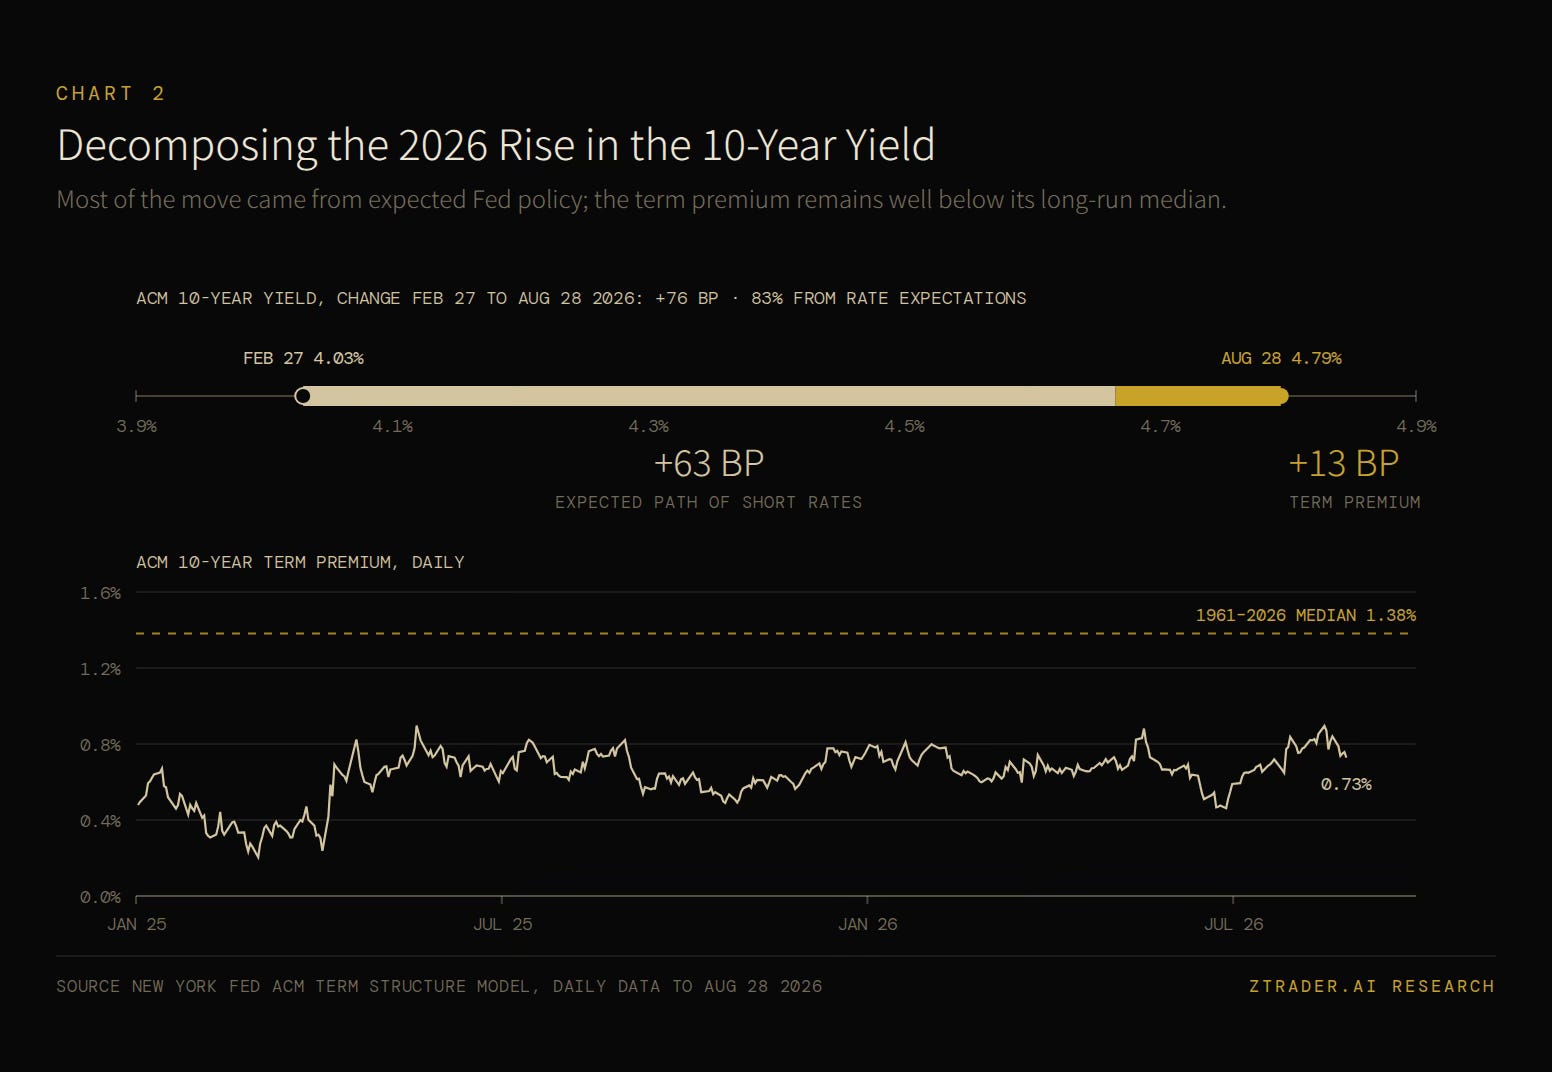
A rise of roughly 125 basis points in the 10-year yield can be split into two parts: the path of short-term rates that investors expect over the next decade, and the extra compensation they demand for holding a long bond through that decade, which economists call the term premium.
The New York Fed’s ACM model put the 10-year term premium at 0.73 percent at the end of August, down from 0.84 percent at the end of July, and the Federal Reserve Board’s Kim-Wright model showed it at 0.96 percent on September 18, up about ten basis points from July.
Both readings sit below the ACM model’s 1961–2026 median of 1.38 percent, and far below the 5.18 percent the same model recorded in May 1984.
On the same model, the 10-year yield rose 76 basis points between February 27 and August 28, and 63 of those basis points came from a higher expected path for short-term rates while only 13 came from the term premium.
Anyone who reads the September highs as a solvency panic has to explain why the component of yields that measures fear of holding duration is still below its own long-run median, and the straightforward reading of the decomposition is that most of this year’s move came from an oil shock feeding into inflation and then into a Fed that has started hiking again.
[CHART 2 — Decomposing the 2026 Rise in the 10-Year Yield]
Auction demand and foreign flows
The September 10 auction of $22 billion in 30-year bonds cleared at 5.308 percent, 2.7 basis points below where the bond was trading beforehand, with a bid-to-cover of 2.61 against a recent average of 2.38 and indirect bidders, the category that captures foreign official and institutional demand, taking 79.5 percent of the issue against an average of 66.4 percent.
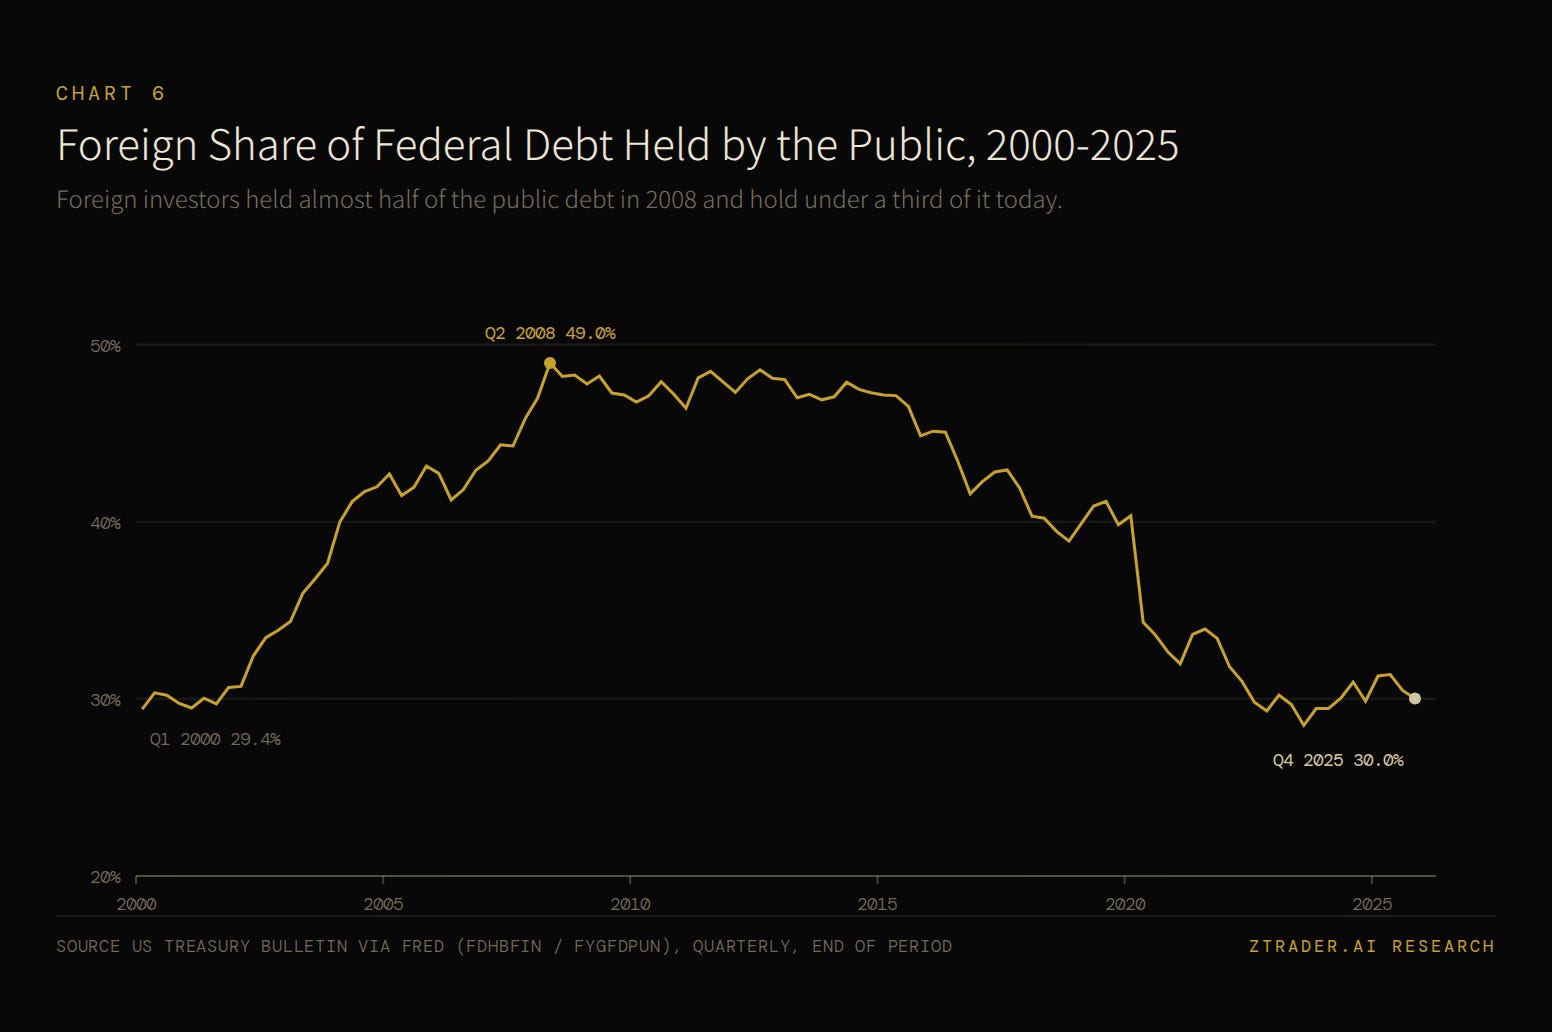
Foreign selling has been real, with Japan and China together cutting their holdings by close to $89 billion in March, but the United Kingdom and the Cayman Islands added about $46 billion in the same month, and the foreign share of federal debt held by the public had already fallen to 30 percent by the end of 2025 from 49 percent in mid-2008, which means foreign central banks stopped being the marginal price-setter for this market years before the current selloff began.
Where the case for a crisis rests
If demand at auction is strong and the term premium is below its median, the word “crisis” needs a different justification, and I find it in what the Treasury has started doing.
On August 19 the Treasury raised the maximum size of its long-dated buyback operations from $2 billion to at least $4 billion, later lifting the ceiling to as much as $6 billion, and it is financing those purchases by issuing more short-term bills. In parallel, the yen intervention that pushed the dollar from near 164 yen back toward 153 was aimed in part at reducing the pressure on Japan, the largest foreign holder with about $1.2 trillion of Treasuries, to sell. Ian Lyngen at BMO has described 5.3 percent on the 30-year as the level the Treasury appears to be defending, and the long bond now trades nearly twenty basis points through that level.
The primary claim of this piece follows from those facts: for the first time since 1951, the United States Treasury is actively trying to manage the price of its own long-term debt while the Federal Reserve moves interest rates in the opposite direction, and the September highs in yields are the running score of that conflict.
Every previous episode in which the fiscal authority tried to set the price of its own bonds has ended with inflation, a forced break in policy, or both.
II. WARTIME FINANCING AND THE 1951 ACCORD
Financing the war at 2.5 percent
In April 1942, at the Treasury’s request, the Federal Reserve committed to holding the Treasury bill rate at 3/8 of a percent and capped the yield on long-term government bonds at 2.5 percent. The Fed stood ready to buy whatever quantity of bonds was needed to keep those yields in place, which meant the Treasury could finance the Second World War at rates it effectively chose, and when the war ended in 1945 the Treasury insisted that the arrangement continue.
Korea and the break
The United States entered the Korean War in June 1950, prices began rising quickly, and by February 1951 consumer price inflation had reached an annualized rate of 21 percent. Holding the 2.5 percent ceiling in that environment would have required the Fed to buy a large volume of new war debt and create the bank reserves that went with it, and the FOMC, having spent the previous year trying and failing to raise short-term rates over Treasury objections, credibly threatened to abandon the peg on its own. The Treasury-Federal Reserve Accord announced on March 4, 1951 ended the Fed’s obligation to support the price of government debt and is still regarded as the founding document of modern Fed independence.
Why 1951 is the template for 2026
The ingredients line up closely: a war, an inflation shock driven by commodities, a Treasury that wanted cheap long-term financing, and a central bank that had concluded low rates were feeding inflation. The main difference is the tool. In the 1940s the Treasury used the Fed’s balance sheet to hold down yields, while in 2026 it is using its own issuance decisions, its own buyback program and the foreign exchange market, which leaves the Fed free to tighten but puts the two institutions in direct opposition on the same curve.
[CHART 3 — 10-Year Treasury Yield Since 1953, With Policy Regimes]
III. KENNEDY’S NUDGE ON THE LONG END
Operation Twist
President Kennedy announced the program on February 2, 1961, and on the same evening the Treasury scheduled a $6.9 billion auction of 18-month notes instead of longer bonds, shifting its own issuance toward the short end.
On February 20 the Fed issued a rare public statement backing the program and began buying Treasuries with maturities of five years or more. The goal was to lower long-term rates to support a weak economy while keeping short-term rates high enough to slow the flow of gold out of the United States, a problem that belonged to the Bretton Woods era but looks familiar to anyone watching the Treasury intervene in the yen this year.
Fifteen basis points
Modigliani and Sutch concluded in 1966 that any effect was unlikely to exceed ten to twenty basis points, and Eric Swanson’s 2011 event study for the San Francisco Fed estimated a cumulative reduction in long-term yields of about 15 basis points, statistically significant and modest in size. That result is the most useful benchmark in this entire history, because in 1961 the Treasury and the Fed were pushing in the same direction with an anchored currency behind them, and the combined effort still bought only about fifteen basis points on the long end. In 2026 the Treasury is running the issuance half of that program alone while the Fed raises rates, so the expected payoff is smaller than it was in 1961.
A bill that came due in the 1970s
Twist ran into the mid-1960s, after which the combination of Vietnam spending and the Great Society expanded deficits while the Fed accommodated them, and Arthur Burns faced sustained pressure from the Nixon White House to keep rates low into the 1972 election. The fiscal side got the cheap financing it asked for through the second half of the 1960s, and the cost arrived as the inflation of the 1970s, which ended only when a Fed chairman was willing to break it.
IV. HOW VOLCKER AND THE BOND VIGILANTES TOOK THE PRICE BACK
Volcker’s peak
Paul Volcker pushed the federal funds rate to about 20 percent in early 1981, and the weekly average of the 10-year yield peaked at 15.68 percent in October of that year. The ACM term premium did not peak until May 1984, at 5.18 percent, nearly three years after yields themselves had turned, because investors who had lived through the 1970s continued to demand very large compensation for trusting that the government would not inflate away the value of its debt again.
Enter the bond vigilantes
Ed Yardeni coined the phrase “bond vigilantes” in 1983 for investors who sold Treasuries in response to fiscal or monetary policy they considered inflationary, and the clearest demonstration of their power came a decade later. Between October 1993 and November 1994 the 10-year yield rose from 5.2 percent to just above 8 percent, the Clinton administration under Robert Rubin’s influence and the new Republican Congress moved toward deficit reduction, and by November 1998 the 10-year had fallen to about 4 percent. James Carville summed up the lesson by saying he would like to be reincarnated as the bond market because “you can intimidate everybody.”
An arrangement working as designed
From 1981 to the late 1990s the price of long-term Treasury debt was set by private investors reacting to policy, the fiscal authority adjusted its behavior in response, and the reward for that adjustment was one of the longest declines in borrowing costs in American history. It was the period in which the arrangement created in 1951 worked as designed.
[CHART 4 — ACM 10-Year Term Premium, 1961–2026]
V. BUYBACKS, WHAT HAPPENS THEN AND NOW
Summers and the surplus buybacks of 2000
In January 2000 the Treasury announced its first buyback of long-term debt in seventy years, the previous one having been carried out under Andrew Mellon in 1930.
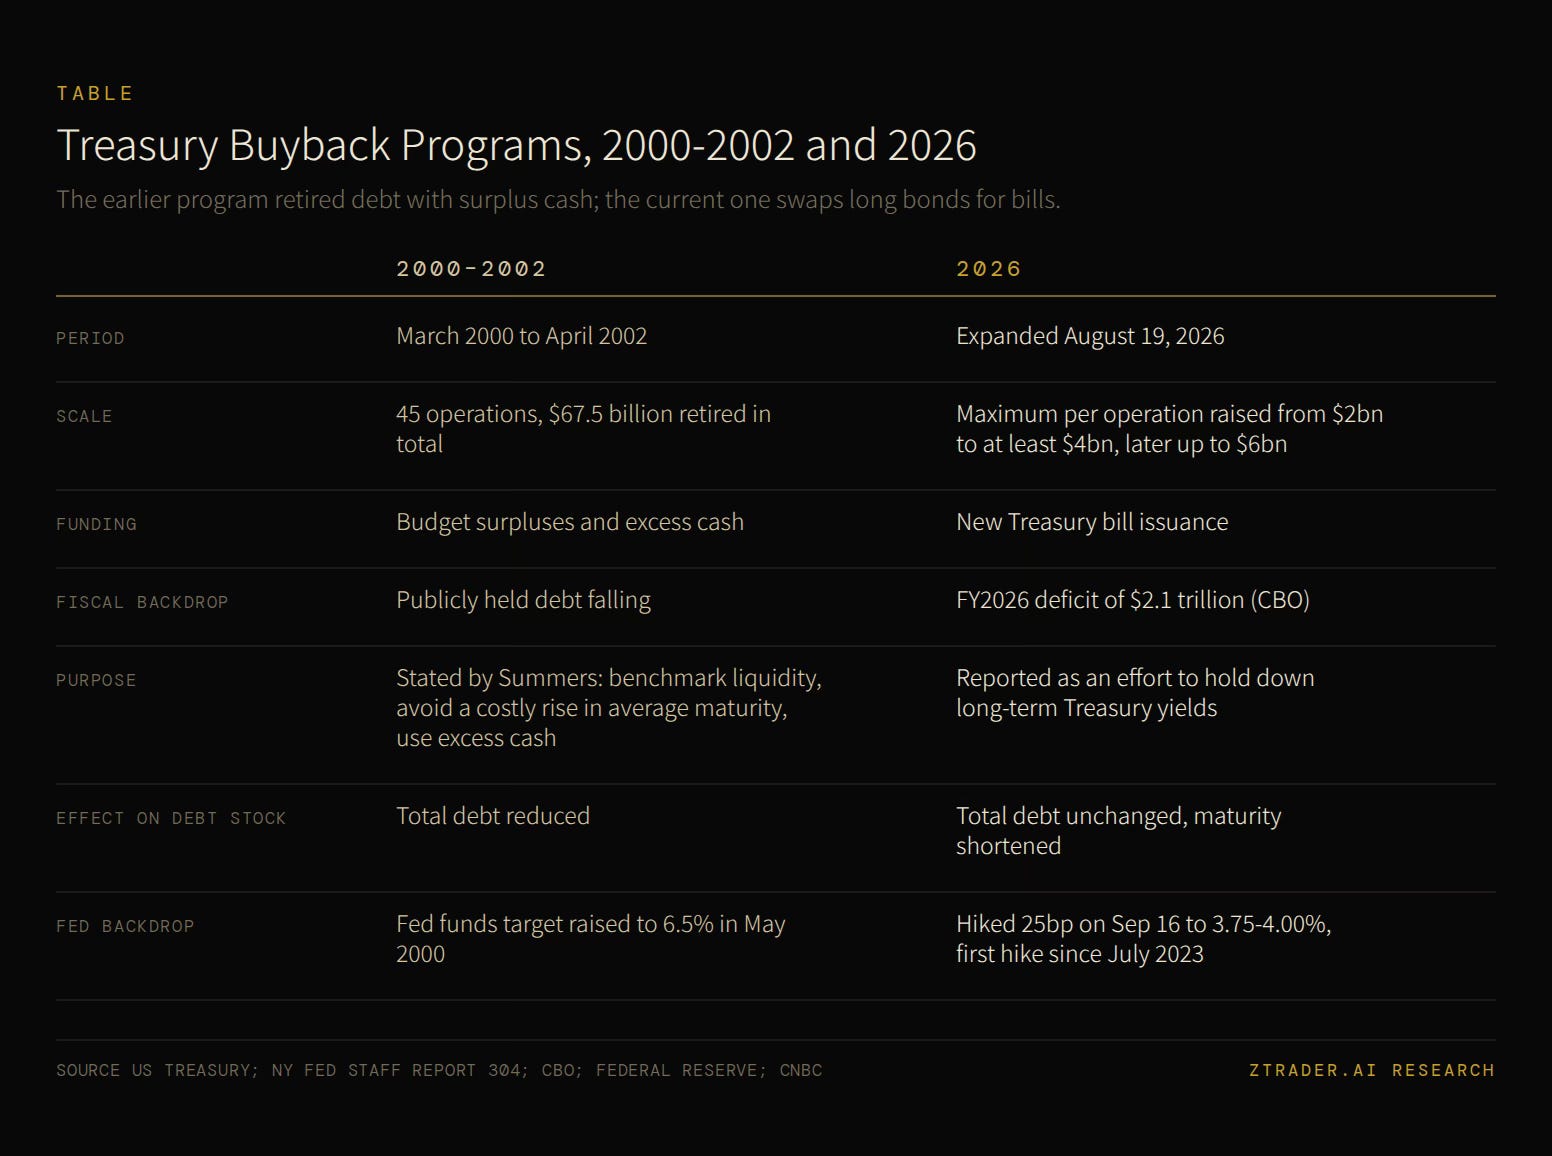
Between March 2000 and April 2002 it conducted 45 operations and retired $67.5 billion of bonds, and then-Secretary Lawrence Summers gave three reasons:
to support liquidity in benchmark issues,
to prevent a costly rise in the average maturity of the debt,
to make better use of excess cash.
The key phrase is excess cash, because the program was financed by budget surpluses and each buyback reduced the amount of debt outstanding.
Bessent’s version, funded with bills
The federal government is projected to run a deficit of $2.1 trillion in fiscal 2026, and the buybacks are being funded with new Treasury bills, so the total stock of debt does not change and only its maturity profile does. That is the Treasury’s side of Operation Twist, carried out without a Fed on the other side of the trade.
Shorter debt, faster DEBT repricing
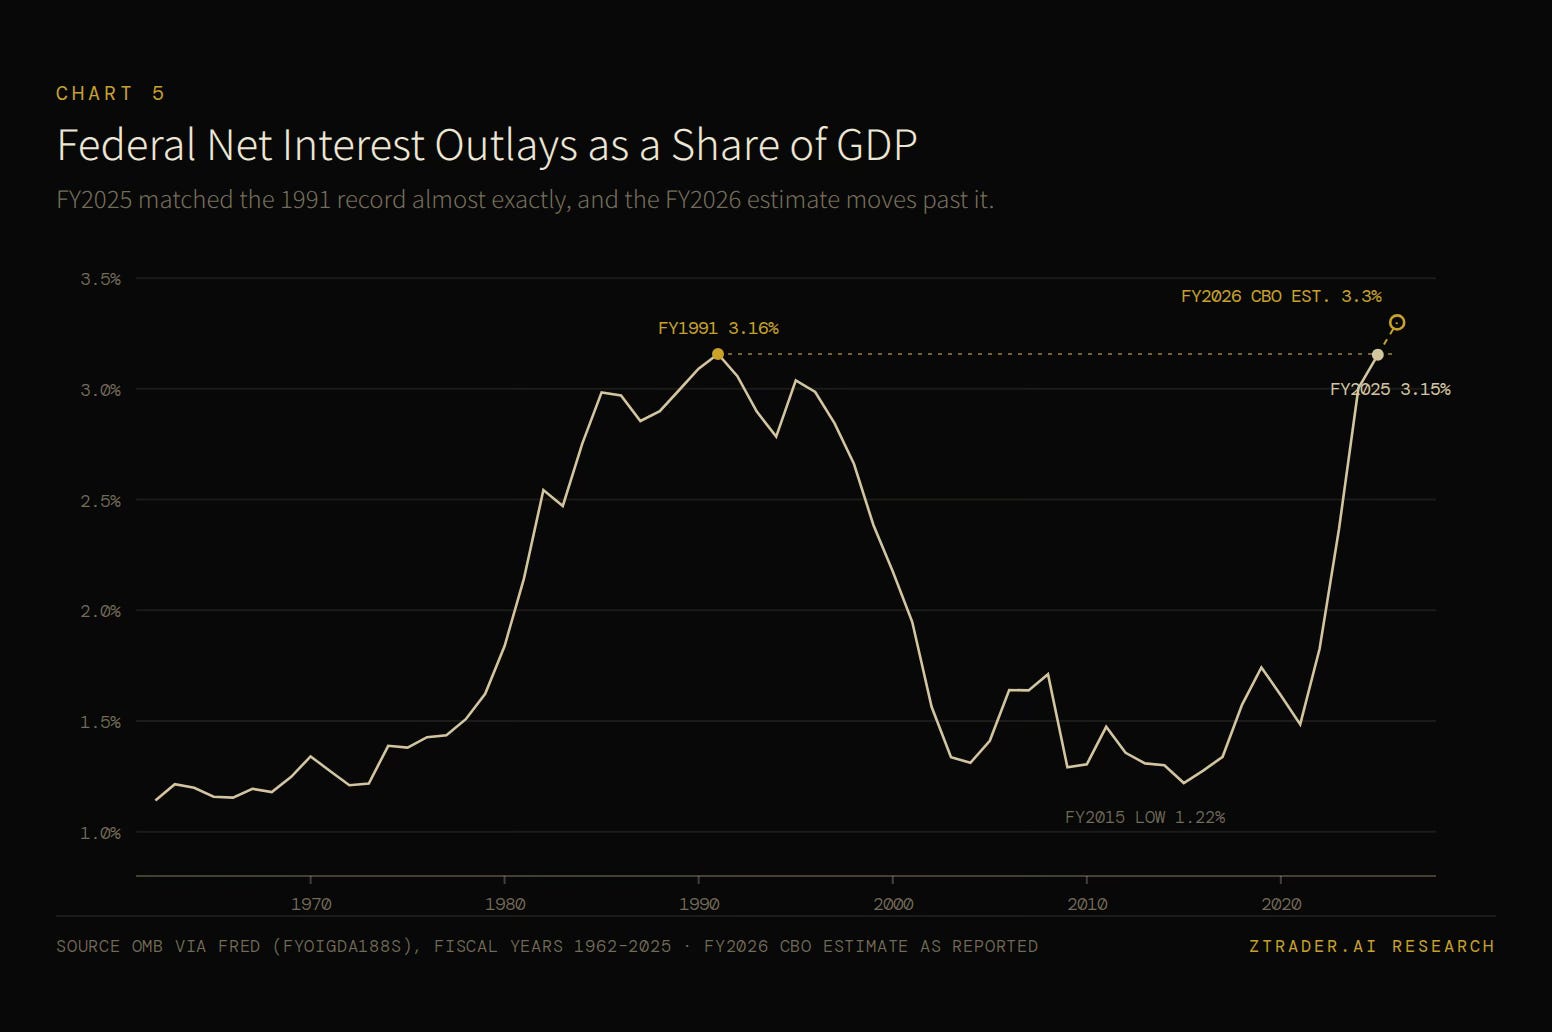
A debt stock that is weighted toward shorter maturities reprices faster when the Fed raises rates. Net interest payments reached $963 billion in the first ten months of fiscal 2026, the annualized figure crossed $1 trillion in August, net interest now exceeds the entire defense budget, and at 3.3 percent of GDP it has passed the previous record set in 1991.
Every additional bill the Treasury issues to buy back a long bond increases the share of that interest bill tied directly to the rate the Fed sets, which means each Warsh hike now reaches the Treasury’s income statement faster than it would have a year ago, and the conflict between the two institutions is being written into the federal budget itself.
Market reaction so far
When the buyback expansion was announced in August the dollar fell nearly 0.8 percent against a basket of currencies, which carries its own inflationary cost through import prices, and when the ceiling was later raised to $6 billion, yields rose because traders had positioned for a larger program. Long-dated yields have since moved to new highs.
[TABLE — Treasury Buyback Programs, 2000–2002 and 2026]
[CHART 5 — Federal Net Interest Outlays as a Share of GDP]
VI. FORTY YEARS OF TAILWINDS, AND WHAT REMOVED THEM
Three supports for the long bull market
From the 10-year’s 1981 peak of 15.68 percent on a weekly-average basis to its low of 0.55 percent in August 2020, the Treasury market had three structural buyers or conditions working in its favor. Inflation was falling for most of that period. Foreign central banks were recycling trade surpluses into Treasuries, lifting the foreign share of publicly held federal debt to 49 percent by mid-2008.
After 2008 the Fed became the largest single buyer, its balance sheet eventually reaching about $9 trillion in 2022, and the ACM term premium fell to a record low of minus 1.36 percent in July 2020.
All three have reversed
Inflation is back above 3 percent on both CPI and core PCE.
The foreign share has dropped to around 30 percent, and the two largest official holders in Asia were net sellers in the spring.
The Fed’s balance sheet is down to roughly $6.7 trillion, its purchases since December 2025 have been limited to short-term bills, and its chairman has spent years arguing that the balance sheet should be smaller.
On the supply side, the One Big Beautiful Bill Act is projected to add $4.2 trillion to deficits through fiscal 2034, and debt held by the public is on course to rise from 101 percent of GDP to 120 percent by 2036, well past the 106 percent peak of 1946.
The credit rating record follows the same arc.
S&P removed the AAA rating in August 2011, Fitch followed in August 2023, the 10-year briefly touched 5 percent in October 2023, and Moody’s downgrade in May 2025 left the United States without a top rating from any of the three major agencies. The April 2025 tariff selloff showed how quickly the long end could move when leveraged holders were forced to unwind.
[CHART 6 — Foreign Share of Federal Debt Held by the Public, 2000–2025]
Arithmetic of a normal term premium
If the ACM term premium simply returned from its end-of-August level of 0.73 percent to its long-run median of 1.38 percent, with the expected path of short rates unchanged, the 10-year yield would rise by roughly 65 basis points.
Allowing for the ten or so basis points the Kim-Wright model suggests have already come through in September, that points to a 10-year yield of around 5.75 percent.
This is pure calculation, and it assumes no further change in the Fed’s path, but it shows how much room remains between current yields and an ordinary historical term premium, before any premium for institutional risk is added.
VII. WARSH’S ACCORD AND THE NEXT TWELVE MONTHS
Warsh’s proposal
Kevin Warsh has argued since 2025 that the United States needs a new Treasury-Fed accord, and in an April 2025 speech he said the spirit of the 1951 agreement was at odds with recent practice. In the version he described, the Treasury secretary would need to find any major change in the Fed’s holdings acceptable, because in his words such changes are “partially fiscal policy in disguise.” Scott Bessent said in May that he was not sure exactly what Warsh meant.
Former Richmond Fed president Jeffrey Lacker told Congress in March that a new pact should restrict Fed asset purchases to short-term Treasuries and leave the maturity composition of the debt entirely to the Treasury, and he warned in May that a less constructive version could let the Treasury use the Fed’s balance sheet to bypass Congress.
Direction of travel
The 1951 Accord removed the Treasury’s claim on the Fed’s balance sheet. A new accord that gives the Treasury secretary a say over that balance sheet would move in the opposite direction, and it would arrive at a moment when the Treasury is already managing the maturity of its debt to influence long-term yields and intervening in currency markets to protect demand from its largest foreign creditor. Put those three together and the Treasury is assembling the tools of long-end price management that the 1951 settlement was designed to take away from it.
Record of past price management
The 1942 peg lasted nine years and ended with inflation running at a 21 percent annualized rate. Operation Twist, with both institutions cooperating, lowered long-term yields by about fifteen basis points. The accommodation of the late 1960s and 1970s ended with a 10-year yield above 15 percent and a term premium above 5 percent that took years to come down.