
The Trader Who Cracked AI's Semiconductor Supply Chain: Inside the Thinking Model Behind a 1,500% Bet, and Where It Breaks
Here are my thoughts on entire AI industry chain

Serenity mapped the photonics supply chain into a tradeable grid of bottlenecks and claims a year-to-date return north of 1,500% doing it.
This piece does two things: it takes the framework apart to see why it works, then it stress-tests every seam to find where it breaks you instead.
Ztrader RESEARCH · June 2026
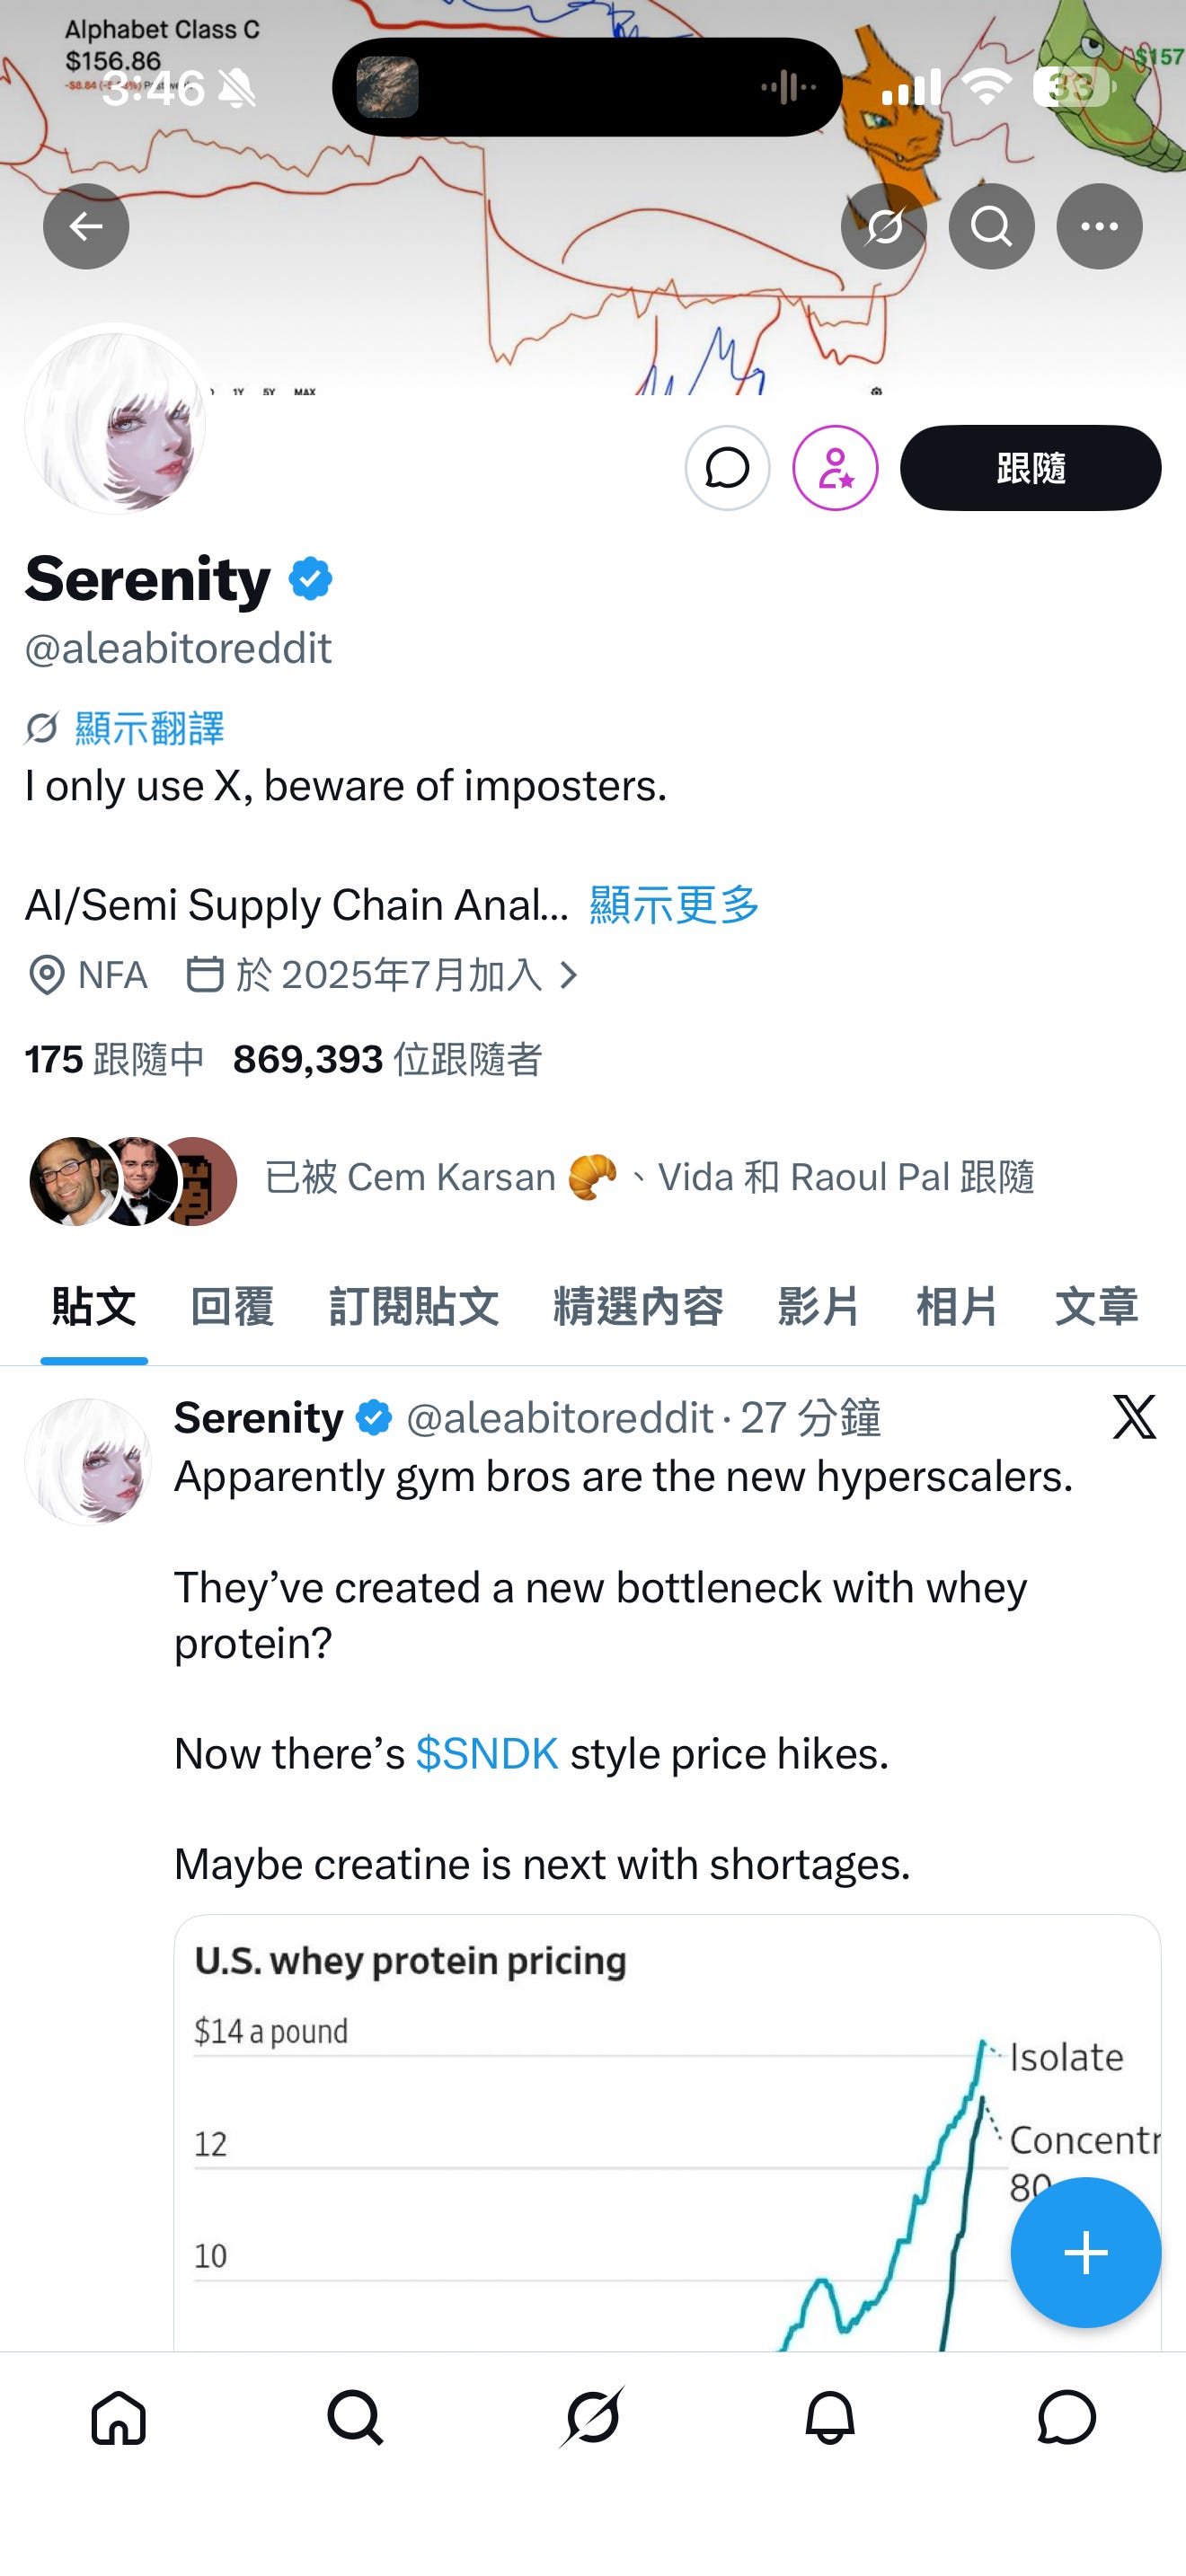
On May 27th, European semiconductor maker X-Fab jumped 70% in a single session.
Bloomberg traced the move to a post from an anonymous account that had only existed since the previous July — a white-haired cartoon avatar, a bio reduced to one line: AI/Semi Supply Chain Analyst, ex RISC-V Foundation, ex AI research scientist, now trading unknown bottlenecks.
That bio is a manifesto disguised as a job title.
It doesn't claim to understand Nvidia.
It doesn't claim to understand macro.
It claims to understand the seam nobody else bothers to look at.
The account is Serenity, a Reddit WallStreetBets exile banned after walking retail traders through a thesis that took AXT Inc. from twelve dollars to seventy.
Inside a year on X, the follower count ran from fifty thousand toward half a million, and his self-reported returns climbed through a string of numbers — 501%, then 630%, then 1,525% — with media write-ups citing figures as high as 4,500%.
None of it is audited.
None of that has slowed the chain of amplification running from American retail forums into Chinese finance newsletters, where he's been crowned something close to an oracle.
The number worth dissecting isn't the return. It's the machinery behind it.
Serenity doesn't even buy Nvidia. He doesn't buy Microsoft. He hunts for the narrow joint those giants depend on but haven't priced — and the hunting method is learnable even when the specific positions aren't. What follows splits into two parts: first, an honest stress test of the framework itself; second, a distillation of what's actually transferable into a process a reader could run without ever trusting a word he says.
"Most people have zero clue what they're talking about — Samsung Foundry and Lumentum's InP fab are completely different parts of the supply chain." — Serenity, responding to a critic
I. The Core Method: Chokepoint Theory
Serenity returns again and again to the same image: twenty percent of the world's oil moves through the Strait of Hormuz, and whoever controls that strait controls global energy flow.
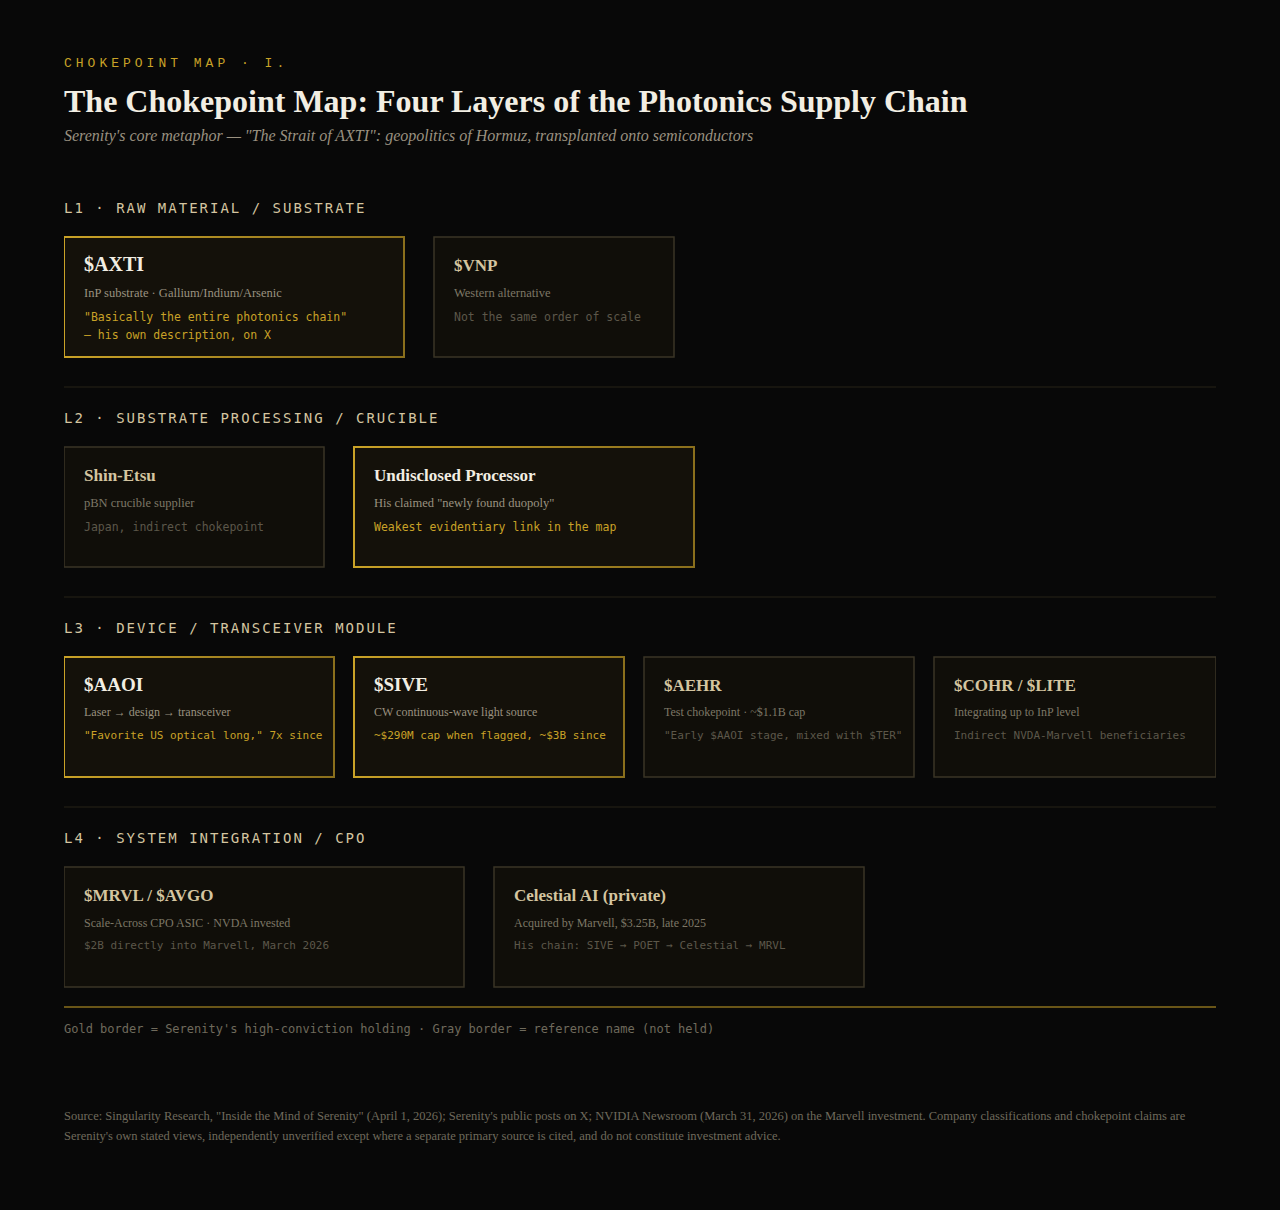
He lifts the geopolitics wholesale and drops it onto semiconductors, calling it the Strait of AXTI — AXT Inc.'s grip on indium phosphide substrate production for the photonics buildout. In his telling, the company stacks four separate chokepoints inside one balance sheet, a vertical integration he says has no real Western equivalent.
The method itself runs the supply chain vertically through four layers: raw materials and substrates at the top, substrate processing and crucible supply beneath that, devices and transceiver modules below that, and system integration through co-packaged optics at the bottom.
At every layer he's hunting for the single node that, if it failed, would stall the entire buildout — and then asking whether the market has priced that failure risk at all.
[CHART 1 — Chokepoint Map: The Four Layers of the Photonics Supply Chain]
The valuable part of this framework was never which tickers he picked.
It's the research habit he's described in public: before publishing a thesis, he goes after the materials science papers and the patent filings looking for the fact that kills his own idea.
He calls the step trying to destroy the idea.
Most research starts by hunting for confirmation; his starts by hunting for the counterexample, and only adds size once the counterexample doesn't turn up. That's a discipline, separable from whether any individual stock works out, and it's the piece worth stealing on its own.
He talks just as often about second- and third-order effects — the idea that an event never stops at the company it hits first, that the shock propagates two or three layers up and down the chain while most market participants only ever see layer one. It's why, when Iran or tariffs dominate the headlines, his first move is asking how the event reshapes scarcity in some obscure material rather than checking where the index futures are trading.
PART ONE · Taking the Framework Apart, Then Stress-Testing It
II. Calling the Rotation: One Chart, Two Readings
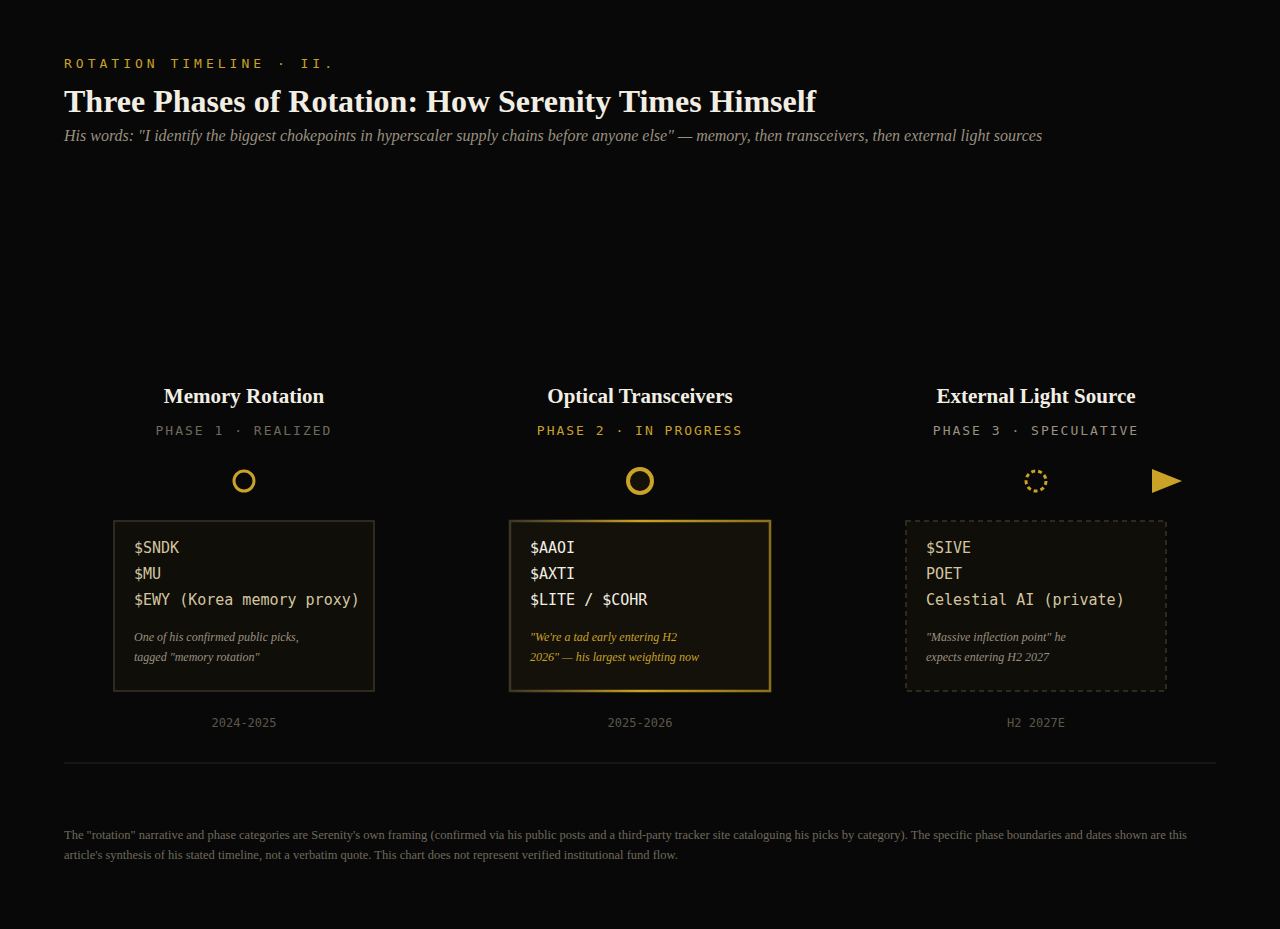
Serenity has built himself a three-phase narrative for timing entries.
Institutional money moved into memory and HBM first — he admits he caught that one late, near the tail.
Then it rotated into optical transceivers, which he says is happening now, with institutional front-runners piling in. Next comes external light sources and silicon photonics, a 2027-2028 story he's already sizing up heavily.
Part of the evidence is Nvidia's three simultaneous $2 billion investments into Coherent, Lumentum, and Marvell for optical work.
Serenity reads this as Nvidia running last year's playbook again — locking up EML laser capacity early to dodge a supply shock before it hits. His conclusion: companies sitting on the next chokepoint in co-packaged optics, Sivers Semiconductors chief among his holdings, are about to see the same capacity-lockdown dynamic play out.
[CHART 2 — Institutional Rotation: Three Phases, From Realized to Speculative]
What's worth learning from the timeline is the real market mechanism it points at: by the time sell-side research formally names a theme — an AI optical interconnect basket, a data center power bottleneck — institutional money floods in systematically, and the first repricing has usually already happened by then.
Inferring where demand will spread before the theme gets a name can genuinely mean positioning ahead of that wave.
But the same chart supports a second reading. He drew the three phases himself, and the boundaries happen to track exactly what he already owns. "Now it's the external light source's turn" could be a real prediction about institutional flow, or it could simply be a tidy justification built backward from a position he'd already bought. Nothing in the chart distinguishes the two. Only time tells you which reading was right.
III. Stress Test: Where the Framework Breaks
Pull back far enough and five structural fractures show up.
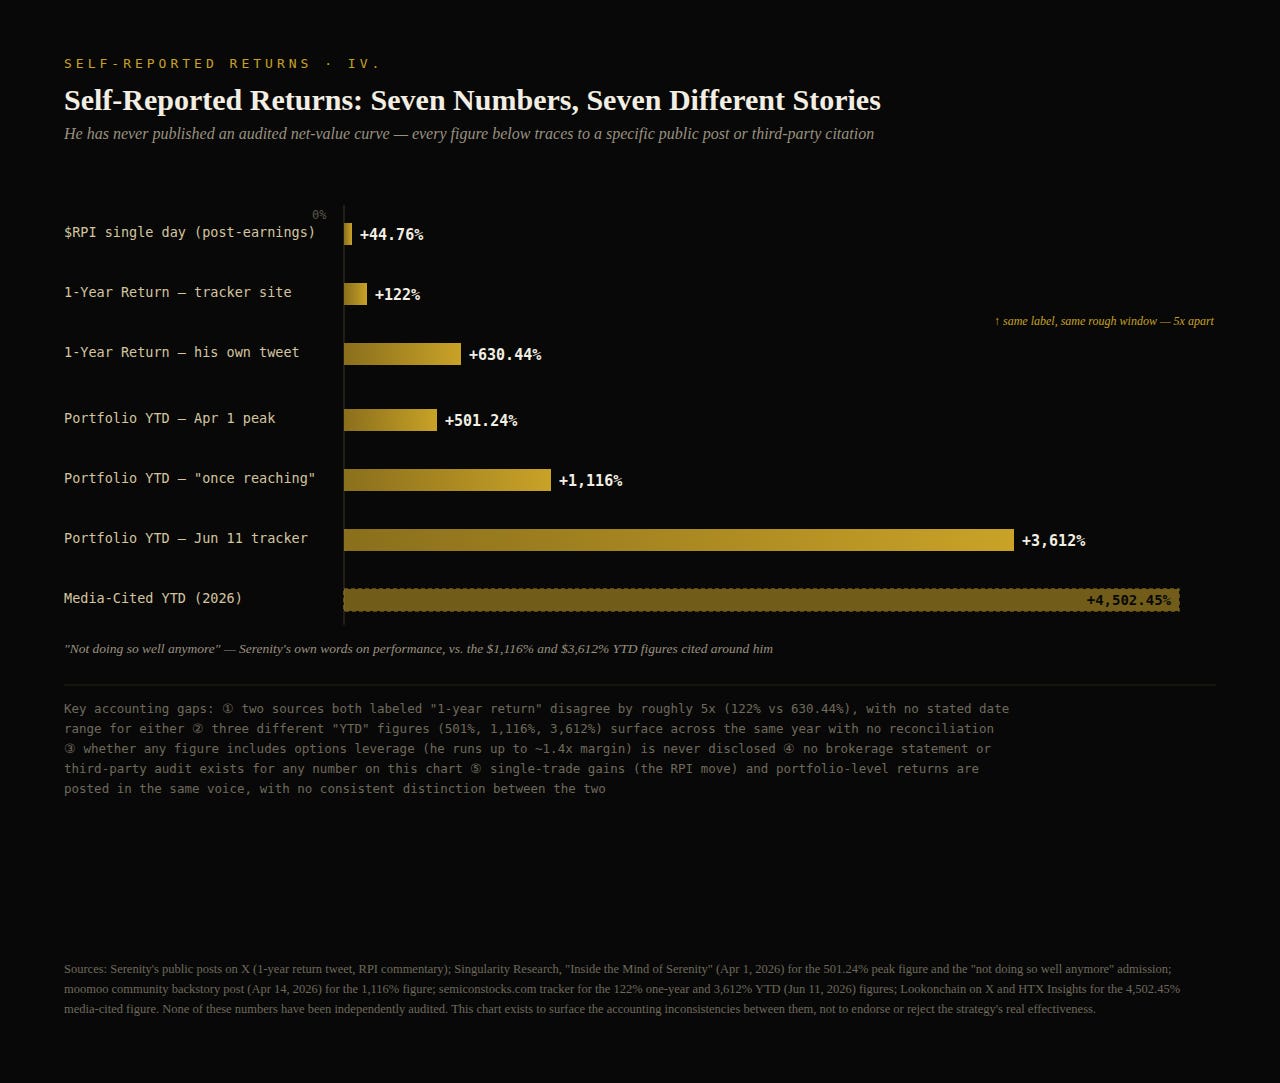
First, the self-reported return figures never settle on one accounting standard. Inside the same stretch of months, the public numbers ran 501%, 630%, 1,525%, with media citations as high as roughly 4,500% — figures that don't reconcile with each other and come with no brokerage statement, no third-party audit. A single trade's gain — one stock's single-day move, a five-day options swing — regularly gets posted in the same breath as the annual portfolio return, which is exactly the kind of framing that lets a reader's mind assemble a smooth high-win-rate curve that may never have existed as a continuous line.
[CHART 4 — Self-Reported Returns: Tickers, Accounting, and Verifiability]
Second, he is part of his own liquidity. An account with several hundred thousand followers naming a $200-300 million company is, on its own, enough to move the stock — the X-Fab 70% day is the proof. That means some share of his own track record is mixed in with the price impact of his own posting. For anyone buying after him, the structure is unforgiving: by the time you buy, the price already contains the portion of the move he manufactured himself. He's the one supplying liquidity. You're the one absorbing it.
Third, evidence quality varies sharply across the layers of his map, but his confidence never does. AXTI's InP substrate position is backed by public capacity data and patent filings — genuinely solid ground. The "newly discovered" substrate-processing duopoly he's referenced doesn't have a name attached yet, anywhere. The evidentiary weight is nowhere close, but the tone he uses to describe both is identical. A reader has almost no way to tell, from voice alone, which layer of the thesis is load-bearing and which is a guess wearing the same jacket.
"YTD 1,525%, as everyone knows." — He rarely posts a scoreboard, and when he does, the number tends to be the peak
Fourth, the leverage and the emotional tolerance are sized to his own capital and his own nervous system, not to the reader's.
He holds nanocaps swinging 15-25% intraday for extended stretches, at times running roughly 1.4x margin.
He calls surviving that volatility conviction, but conviction is a word that only gets applied after the fact — survive the drawdown and it's conviction, blow up and it's a margin call, and the label itself does no risk management for anyone.
Fifth, the narrative has enough elasticity that it's nearly impossible to falsify in real time.
Second-, third-, fourth-order effects is a framework flexible enough to absorb almost any outcome, which means it can absorb a wrong outcome just as easily as a right one. When performance genuinely reversed — he admitted as much in April, conceding things hadn't been going so well lately — the story simply slides into its next phase rather than getting logged as a clear miss.
Put the five together and they share one root.
The entire method is produced inside an environment with hundreds of thousands of viewers, built on a reputation for transparency. That environment is exactly what forces the discipline that makes the framework useful — say your logic out loud, show your position. It's also exactly what removes any incentive to audit a self-reported number, log a failed call, or disclose your own market impact. What a reader gets is the highlight reel, curated by definition. It was never the full trading log.
· · ·
PART TWO · A Process You Can Actually Run
IV. Don't Copy the Trade. Copy the Method.
Strip away Serenity's specific holdings and ask what's left to use. The answer is real, but what travels is the process, not the ticker list. Reorganize what he's described doing in public into a five-step sequence, and in principle anyone can run it without trusting a single word he's said.
1. Work backward from the endpoint, not forward from the headline winner.
Pick a company the market has already agreed is an AI beneficiary — Nvidia, Microsoft, take your pick — then ask one specific question: which structural dependency in its build-out plan hasn't been priced yet?
The answer rarely sits in a headline. It sits in a capex breakdown and a supplier list.
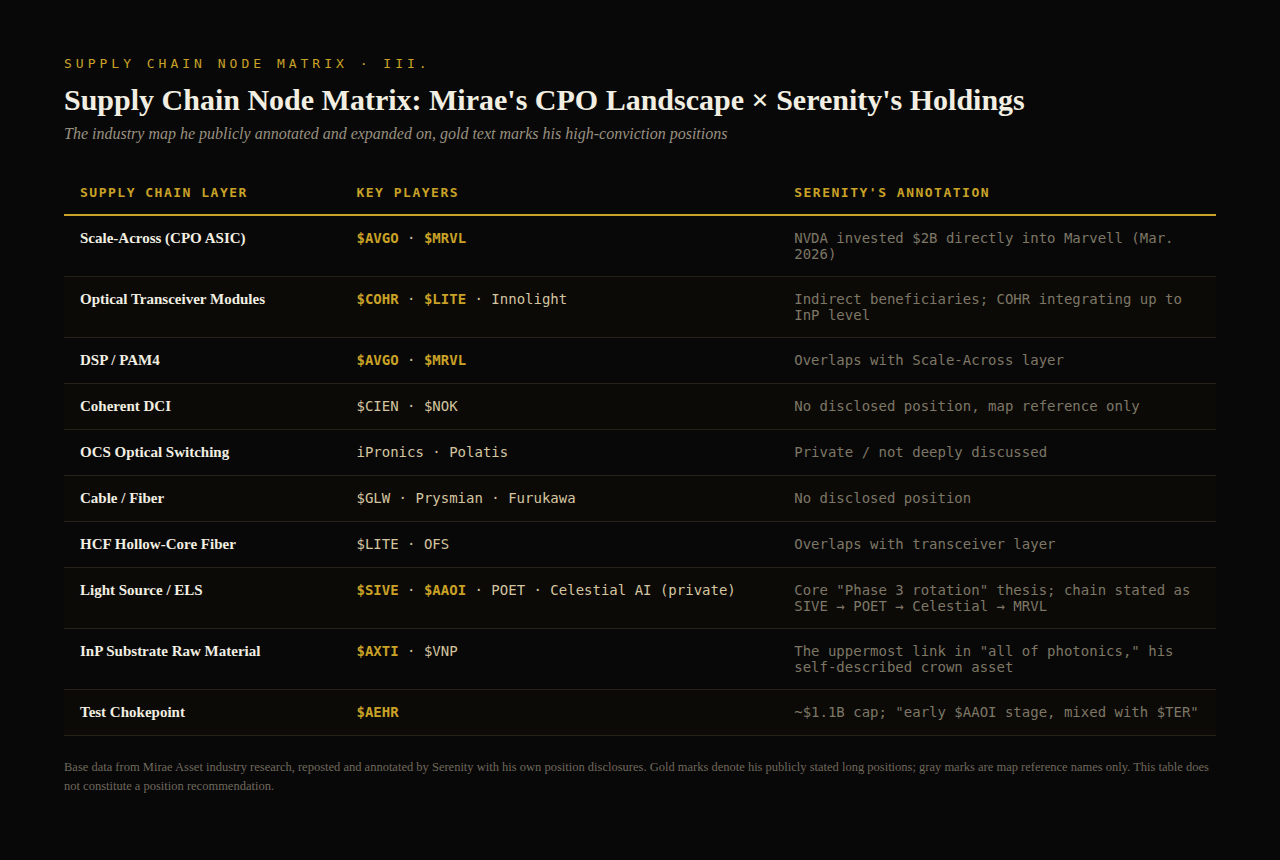
2. Draw a map, not a list.
Lay the supply chain out vertically — raw material, processing, device, integration — naming the major players at each layer, and be honest about which layer rests on solid evidence and which is speculation. A map worth trusting carries its own uncertainty markers. It doesn't paint every node the same confident color.
3. Run the self-falsification pass before sizing anything.
Before drawing a conclusion, go hunting for the alternate supplier, the substitution risk, the weakest link in the demand assumption.
The point of the step isn't to talk yourself into the trade — it's to find where you're most likely to be wrong, and size up only once that search comes up empty.
4. Confirm with earnings and orders, not with engagement. A thesis going viral and the stock popping the same day proves the post traveled. It proves nothing about whether the thesis was right. The real confirmation arrives in the next print or the next purchase order, and until then, position size should stay exploratory.
5. Size to market cap and liquidity, not to conviction.
This is the rule Serenity himself violates most visibly, which is exactly why it's the one worth holding onto even when he doesn't. On a $200-300 million name trading thin daily volume, no amount of subjective certainty should override a hard liquidity constraint on position size. "How sure I feel" is not a sizing input.
[TABLE — Supply Chain Node Matrix: Turning an Industry Landscape Into a Working Sheet]
V. Where Copying This Actually Kills People
The process reads clean on paper. In practice, it breaks in three predictable places.
The first trap is the time lag.
When Serenity calls a post "early," it's early for him — he'd already quietly built the position before publishing.
For a reader who starts researching only after seeing the tweet, the price has usually already moved. Mistaking someone else's early for your own early is the most common way this framework gets you killed.
The second trap is mistaking the confidence of the delivery for the quality of the evidence.
His replies to skeptics tend to be blunt and unyielding, and that tone reads to a follower as he must know something I don't.
But tone and evidence are two separate variables — a person can deliver a thin guess with exactly the same certainty as a well-documented conclusion, and the unnamed "substrate processing monopoly" mentioned earlier is the case study sitting right there.
The third trap is copying the position structure instead of the research process.
A portfolio running 1.4x margin in nanocaps swinging 15-25% a day demands a matching capital base, a matching nervous system, and a matching exit discipline.
Most retail traders who try to replicate this framework copy the shell of the research process and inherit a position structure that blows straight through their actual risk budget — and that mismatch is the one most likely to be fatal.
There's no secret hiding inside a supply chain. There's only the layer nobody's priced yet. Whether you can find it has nothing to do with whether you believe Serenity.
References:
This piece is based on Serenity's (@aleabitoreddit) public posts on X, Singularity Research's "Inside the Mind of Serenity" (April 1, 2026), Bloomberg coverage, and publicly compiled commentary from Chinese financial media.
All return figures and position claims referenced are unverified, self-reported statements from the parties involved and have not been independently audited or confirmed. Nothing here constitutes investment advice, nor does it represent a recommendation or warning regarding any security mentioned. Past performance does not predict future results.