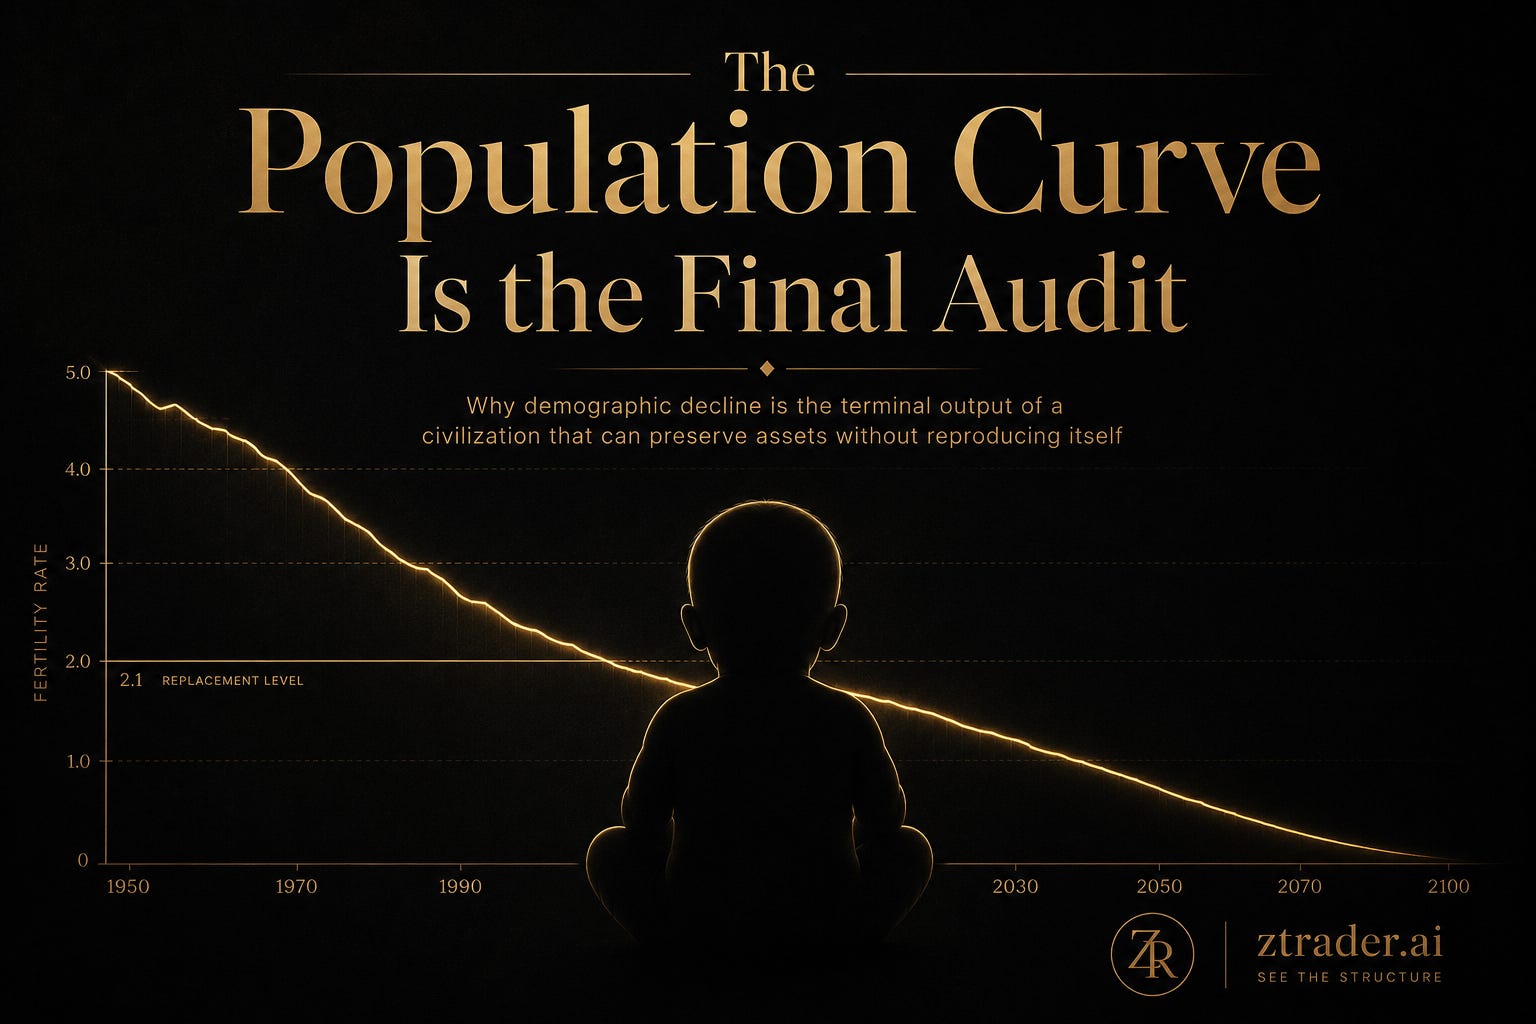
The Population Curve Is the Final Audit
A civilization can preserve its assets, refinance its debt and stabilize its markets.
If it cannot reproduce itself, none of those achievements amount to stability.
Modern economies are obsessed with measurement.
We track GDP, employment, inflation, credit growth, bond yields and asset prices with microscopic intensity. Markets react to decimal points.
Central banks recalibrate guidance after the slightest tremor in financial conditions.
Governments celebrate nominal growth while quietly revising everything that matters several years into the future.
Yet one variable sits beneath the entire edifice:
The population curve.
Economists usually treat demography as an exogenous assumption: an input used to estimate labour supply, pension liabilities, tax revenue and potential growth.
This framing is backwards.
Population is not merely an input into the economic system. It is one of the system’s terminal outputs.
It records whether people can form households, whether they possess enough time and security to assume irreversible obligations, whether institutions appear durable and whether the future remains credible enough to justify creating another human being.
A system may support nominal GDP, prevent bank failures, lift property values and refinance sovereign debt.
But if it cannot generate the conditions under which people are willing and able to build families, it is not stable.
It is preserving the present by consuming the conditions required for the future.
The Terminal Function
A birth is not an ordinary consumption decision.
It is a high-stakes, multi-decade commitment of income, housing, care, time, emotional capacity and institutional dependence. It is illiquid, largely irreversible and exposed to risks that cannot be hedged through a quarterly portfolio rebalance.
At the individual level, fertility decisions remain personal. Biology, partnership, preference, health, culture and chance all matter.
At the aggregate level, however, the population curve becomes a revealed output of the civilization runtime.
It can be represented as:
DEMOGRAPHIC CONTINUITY
=
Household Formation Capacity
× Housing Access
× Real Income Security
× Time Capacity
× Relationship Stability
× Care Infrastructure
× Intergenerational Fairness
× Institutional Trust
× Future Confidence
This function is closer to multiplicative than additive.
That distinction matters.
If one critical variable approaches zero, the total output can collapse even when several other components remain strong.
High income × No time =Low commitment capacity
Generous childcare X No housing = Low household formation
Affordable housing
× No future confidence
= Low demographic continuity
This is why many pronatalist policies fail to move the curve in a durable way.
A tax credit can reduce one local cost. A cash transfer can temporarily change the timing of a birth. A childcare expansion can remove one constraint.
But none of these measures automatically repairs housing scarcity, precarious employment, excessive working hours, unequal care burdens, relationship instability or collapsing confidence in the future.
Governments optimize one module while the operating system continues to fail.
The OECD reaches a similarly uncomfortable conclusion. Its research finds that fertility is associated with employment conditions, parental leave, childcare, housing costs and economic insecurity, but that a large share of the variation remains unexplained by these factors alone. Even countries with relatively comprehensive family-support systems have seen fertility fall toward the OECD average. (OECD)
The Visible Collapse
The aggregate data are not subtle.
The OECD average total fertility rate fell from 3.3 children per woman in 1960 to 1.5 in 2022. After falling to 1.65 in 2002, it briefly recovered to 1.76 in 2008 before resuming its decline. OECD projections published in 2025 placed the average at a projected low of approximately 1.46 in 2025, far below the approximate replacement threshold of 2.1 under assumptions of no migration and unchanged mortality. (OECD)
Chart 01: The OECD Fertility Collapse
Sources: OECD, Society at a Glance 2024; OECD, Pensions at a Glance 2025.
Population as Revealed Commitment
People can tell surveys that they value family, want children or believe the future will improve.
Stated preference is cheap.
Implemented commitment is not.
The more revealing questions are behavioural:
Do people leave the parental home?
Can they establish independent households?
Can they secure stable work and housing?
Do they marry or form durable partnerships?
Do they have a first child?
Do they proceed to a second?
Do they remain in the country?
Do they accept decades of care obligations?
In 2022, roughly one in two OECD adults aged 20–29 still lived with their parents. The figure varies sharply across countries, but it captures the widening distance between biological adulthood and economic independence. (OECD)
The population curve therefore functions as an aggregate long-duration commitment index.
It does not measure whether people are momentarily optimistic.
It measures whether they are willing to convert optimism into irreversible action.
That makes it harder to manipulate than the indicators governments normally prefer.
Nominal GDP can rise through inflation and public spending.
Employment can be sustained through low-productivity jobs.
Asset prices can be supported through lower discount rates and official backstops.
Public liabilities can be rolled forward.
A future child cannot be created through accounting treatment.
The Distributional Trap
The link between monetary policy and fertility is not direct.
The crude version would be:
QE
→
Low fertility
That is not the thesis.
The stronger mechanism is:
POLICY REGIME
→
ASSET PRICES AND CREDIT CONDITIONS
→
BALANCE-SHEET DISTRIBUTION
→
DIFFERENT ENTRY COSTS ACROSS COHORTS
→
HOUSEHOLD FORMATION
→
DEMOGRAPHIC OUTPUT
Monetary easing can preserve employment, reduce debt-service costs and prevent a liquidity shock from becoming a depression.
Those effects may support family formation.
But repeated asset-protective intervention also distributes gains and losses unevenly.
Existing property owners receive higher collateral values and greater balance-sheet protection. Renters and first-time buyers may confront higher entry prices.
Large incumbents may refinance cheaply, while young firms and households remain constrained by weak collateral, insecure income or uncertainty.
OECD research finds a clear negative association between fertility and housing costs, while also recognizing that housing wealth can support childbirth among existing owners. The same increase in house prices can therefore improve security for an incumbent household and make family formation less attainable for a younger entrant. (OECD)
That is the structural point.
The important question is not whether an intervention produces a single average benefit.
It is:
Which node retains the upside, which node avoids the immediate loss, and where is the adjustment ultimately transmitted?
Restorative Intervention vs Distortive Intervention
Not every intervention pollutes transmission.
A central bank can restore market plumbing by providing temporary liquidity against sound collateral, preventing forced liquidation and preserving payment-system continuity.
That is restorative intervention.
Distortive intervention is different.
It protects insolvency rather than liquidity.
It delays loss recognition.
It preserves weak incumbents, shields management and capital from the consequences of failed allocation and removes the termination condition from economic error.
RESTORATIVE INTERVENTION
=
Liquidity restored
+ Losses recognized
+ Exit preserved
DISTORTIVE INTERVENTION
=
Valuation protected
+ Insolvency concealed
+ Exit blocked
The distinction is not whether the state acted.
The distinction is whether intervention repaired transmission or corrupted it.
Loss is not merely pain.
Loss is information.
It tells the network that a project, institution, asset price or management team should no longer control the same quantity of resources.
When that information is prevented from reaching the original decision-maker, the loss does not vanish.
It changes routes.
Suppressed market loss
→ Currency dilution
→ Fiscal burden
→ Capital misallocation
→ Lower productivity
→ Housing exclusion
→ Intergenerational transfer
The bust is not eliminated.
It migrates.
The Fiscal-Financial Trap
This mechanism becomes more dangerous when public debt is high and the financial system is heavily dependent on sovereign collateral.
The BIS’s 2026 Annual Economic Report warns that high public debt and the growing fiscal-financial stability nexus complicate monetary transmission and increase the risk of sovereign-market dysfunction. Such episodes may threaten financial stability and leave central banks with little choice but to intervene, even when intervention conflicts with the monetary-policy signal they are trying to transmit. (bis.org)
The result is a structural conflict.
A central bank may need higher rates to contain inflation.
But higher rates also increase sovereign debt-service costs, reduce bond values and transmit stress through banks, pension systems, insurers and leveraged non-bank institutions.
The official reaction function may still be described as:
Inflation
Employment
Financial stability
The effective reaction function becomes:
Control inflation
subject to
sovereign refinancing,
bank collateral,
pension solvency,
market liquidity
and asset-price constraints.
No secret committee is required.
The political asymmetry is built into the system.
Existing pensioners vote today.
Property owners vote today.
Banks and asset managers possess legal claims, institutional representation and lobbying capacity today.
Future taxpayers are dispersed.
The unborn have no vote, no balance sheet and no representative at the policy meeting.
Current losses are concentrated and visible.
Future losses are diffuse and discounted.
Guess which category receives the emergency facility.
From Social Outcome to Fiscal Constraint
Once fertility remains below replacement for long enough, demography stops being merely a social outcome.
It becomes a binding fiscal and monetary constraint.
Across the OECD, the old-age dependency ratio rose from 19% in 1980 to 31% in 2023 and is projected to reach 52% by 2060. Over the same horizon, the working-age population is projected to decline by 8% across the OECD and by more than 30% in over one-quarter of member countries. (OECD)
Ageing-related public expenditure on pensions and health is projected to increase by a cumulative average of around three percentage points of GDP by 2060. Under baseline demographic and productivity assumptions, OECD work also estimates that GDP per capita in 2060 could be around 14% below the level implied by continuation of the earlier labour-input growth path. (OECD)
Chart 02: The Demographic-Fiscal Squeeze
Source: OECD, Employment Outlook 2025; OECD, Women, Work and the Population Puzzle.
The Demographic-Monetary Feedback Loop
The system now closes on itself.
LOW FERTILITY
→
WORKING-AGE POPULATION DECLINES
→
POTENTIAL GROWTH WEAKENS
→
TAX BASE GROWS MORE SLOWLY
→
PENSION AND HEALTH BURDENS RISE
→
PUBLIC DEBT PRESSURE INCREASES
→
PRESSURE TO CONTAIN FUNDING COSTS RISES
→
ASSET AND SOVEREIGN SUPPORT BECOME MORE IMPORTANT
→
INTERGENERATIONAL ENTRY COSTS RISE
→
HOUSEHOLD FORMATION WEAKENS
→
LOWER FERTILITY
The fewer future nodes appear, the more aggressively the system must protect claims inherited from the past.
The more aggressively those past claims are protected, the harder it can become for future nodes to appear.
That is the contradiction at the centre of the model.
A civilization may preserve the nominal value of pensions, sovereign bonds and property while weakening the real economic base required to honour all three.
The dashboard can remain green while the replacement function fails underneath it.
Korea and the Arithmetic of Compounding
Korea is the clearest advanced-economy demonstration of what ultra-low fertility means when compounded across generations.
Its total fertility rate fell from approximately six children per woman in 1960 to 0.72 in 2023.
A fertility rate near 0.7 does not merely mean “fewer children.”
It changes the scale of the civilization.
The OECD illustrates the arithmetic directly: for every 100 people in the current parent generation, a fertility rate of approximately 0.7 implies roughly 35 children and only around ten grandchildren. (OECD)
Chart 03: Demographic Compounding at a TFR of 0.7
Source: OECD, Korea’s Unborn Future, 2025.
Under an OECD baseline in which fertility remains near current levels and immigration follows historical trends, Korea’s population is projected to halve over roughly six decades.
People aged 65 and above would account for around 58% of the population, while the old-age dependency ratio would rise from 28% to 155%. Even in an optimistic scenario in which fertility recovers to 1.85, the dependency ratio would still reach 117%, because demographic momentum is already embedded in the age structure. (OECD)
That is the nature of the lag.
Interest rates can change at a policy meeting.
A missing generation cannot.
By the time the fiscal consequences become impossible to ignore, much of the underlying demographic structure has already been compiled.
Reproductive Exit
When a system no longer offers a credible future, individuals do not necessarily march in the street.
They can leave quietly.
Delay marriage
Delay independence
Delay housing
Delay childbirth
Have fewer children
Avoid irreversible commitments
Migrate
Withdraw from the continuity contract
This is reproductive exit.
It is not always ideological.
It does not require a conscious rejection of society.
It is the aggregate outcome of millions of individually rational decisions made under constrained conditions.
The state may ask people to reproduce the system.
The household asks:
At what cost?
In what housing?
With whose time?
Under which care burden?
Supported by what income?
For what future?
When the system cannot answer, it offers a small subsidy and a colourful campaign slogan.
Civilizations, apparently, can be operated by the same people who believe a coupon repairs a broken transmission mechanism.
Why the Academic Debate Remains Incomplete
Academic research is correct to separate the effects of housing, employment, childcare, gender roles, education costs and cultural preferences.
Those are necessary causal questions.
But they are partial derivatives:
∂ Fertility / ∂ Housing
∂ Fertility / ∂ Income
∂ Fertility / ∂ Childcare
∂ Fertility / ∂ Working Time
The larger question concerns the total function:
Fertility
=
Civilization(
economy,
assets,
time,
family,
trust,
institutions,
future
)
The important research problem is not merely identifying which variable carries the largest average coefficient.
It is identifying the minimum viable combination of conditions under which household formation remains possible.
Some variables are substitutable.
Others are bottlenecks.
Several interact multiplicatively.
A policy may improve childcare but leave housing and working time untouched. It may increase cash support while employment remains precarious. It may subsidize mortgages while simultaneously inflating the price of the underlying asset.
The local metric improves.
The terminal output does not.
That is not a mystery.
It is a system with the wrong objective function.
Minimum Viable Civilization
A civilization capable of reproducing itself requires more than births.
It requires a viable transmission environment.
MINIMUM VIABLE CIVILIZATION
=
Affordable Household Formation
+ Stable Real Income
+ Sufficient Time
+ Credible Care Infrastructure
+ Manageable Education Costs
+ Functional Relationship Contracts
+ Intergenerational Fairness
+ Institutional Trust
+ A Believable Future
This does not mean every society must maximize births or pursue perpetual population growth.
Individual autonomy remains fundamental. Migration can alter population trajectories. Productivity can support living standards with fewer workers. Environmental limits matter.
But those observations do not erase the signal.
Sustained fertility far below replacement, delayed household formation, rapid ageing and rising dependence on future transfers reveal a deep mismatch between the system’s inherited claims and its capacity to generate new participants.
A society may continue to operate.
It may continue to borrow.
It may continue to support asset prices.
It may even appear prosperous.
But if future nodes do not deploy, the system has failed its final compilation.
Final Judgment
The population curve is not another macroeconomic indicator beside inflation, unemployment and GDP.
It is where all of them eventually meet.
It records whether income is secure enough, housing is accessible enough, time is available enough, relationships are stable enough and the future is credible enough for people to assume one of the longest and most irreversible commitments available to them.
Modern policy regimes have become highly capable of preventing visible market-level losses.
They can refinance debt, backstop liquidity, support collateral and preserve incumbent balance sheets.
But when those interventions protect past claims while raising the entry cost for future households, the adjustment has not been eliminated.
It has been rerouted.
The market-level bust is postponed.
The civilization-level bust emerges later through declining household formation, falling fertility, a shrinking tax base, rising dependency and increasing pressure to defend the same inherited claims that helped produce the imbalance.
The final failure of a civilization is not a stock-market crash.
It is losing the capacity and willingness to reproduce itself.
When a system can preserve everyone who already holds a claim, but cannot create conditions under which the next generation is willing to appear, that is not stability. It is the extension of decline.
And the hardest formulation remains:
The old nodes that were not permitted to die eventually begin consuming the unborn nodes that were supposed to replace them.


