
THE MOST EXPENSIVE MOUTH ON EARTH: TRUMP TALK REWIRED THE OIL CURVE — AND SENT THE BILL TO THE LONGS
WHY OIL TRADERS KEPT LOSING MONEY?


WTI’s front month has stopped pricing barrels. It prices the half-life of a presidential sentence. The $25–$40 gap between prompt crude and December 2026 is the market’s invoice for believing him — and somebody pays it every single day.
By ZTrader Research · June 2026
blog.ztrader.ai
Ninety days ago, crude oil was the most boring trade in macro. The EIA and J.P. Morgan were penciling in fifty-eight-dollar oil for 2026. U.S. inventories had just printed a sixteen-million-barrel weekly build, the largest in three years.
Saudi exports were pushing toward a three-year high.
WTI drifted between $62 and $67 while everyone argued about a structural glut. Then, on February 28, the U.S.–Israeli war against Iran began — and within a single week, U.S. crude posted its biggest weekly gain since the futures contract was born in 1983, up roughly 35 percent. On March 9 the Strait of Hormuz was effectively closed, trapping the artery that carries roughly a fifth of global supply. Front-month WTI crossed $112. Dated Brent printed above $140 for the first time since 2008.
That is the part everyone knows.
Here is the part that decides whether you make or lose money:
the violence did not happen to price.
It happened to time.
The oil market did not simply mark crude higher — it tore the futures curve into two different markets that now barely speak to each other.
The front of the curve became a war instrument. The back of the curve stayed a barrel instrument. And the man with the largest microphone on the planet spends every week shaking the front end like a snow globe while the back end barely registers his existence.
Backwardation is not a chart pattern. It is an invoice — and the curve tells you exactly who is being billed.
I. WHAT THE CURVE IS ACTUALLY SAYING
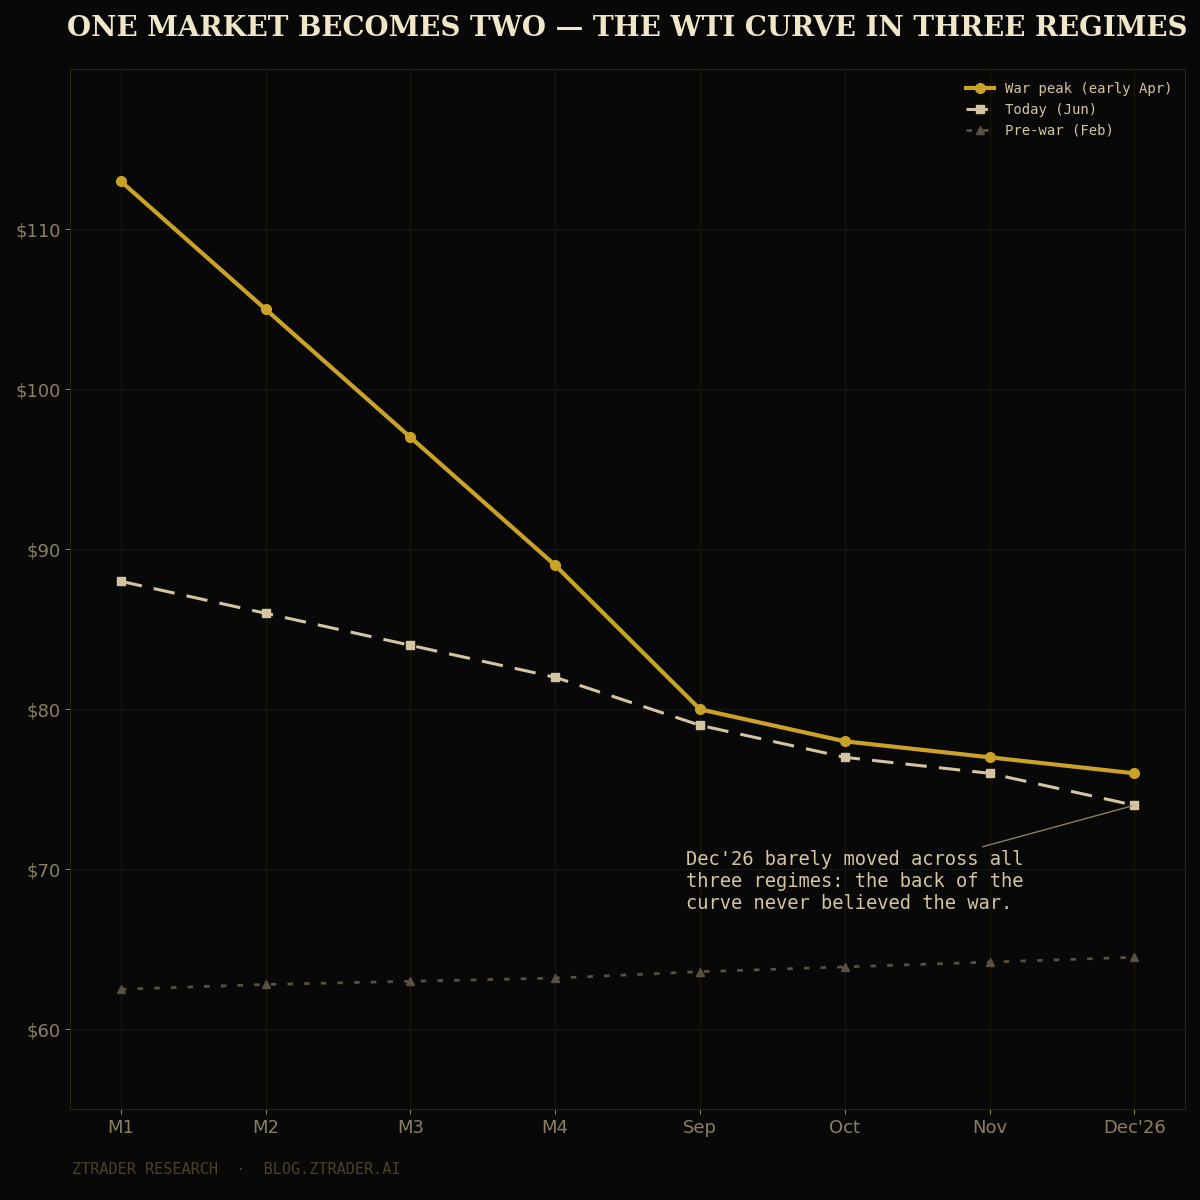
Start with the raw geometry. At the early-April peak of the panic — the day of Washington’s strike deadline against Iranian infrastructure — front-month WTI traded near $113 while the September contract sat near $80. December 2026 delivery traded as much as $40 below the prompt months. The market-to-next-month spread had earlier blown out to a record $14.20: physical buyers paying a fourteen-dollar premium for a barrel today over a barrel in thirty days.
Translate that out of trader dialect.
A futures curve is not a forecast pinned to a wall; it is a probability distribution over disruption duration, settled in cash.
Extreme backwardation says, in one sentence: “The shortage is real, and it is temporary.”
Every dollar of slope between the front month and December is the market’s estimate of how fast the Hormuz premium dies. The front month is not “oil.” It is a synthetic option on the proposition that the strait stays shut through that specific delivery window — and the slope of the curve is the option’s theta, printed publicly, updated every second.
[CHART 1 — From Glut to Gunfire: WTI Front-Month, January–June 2026]
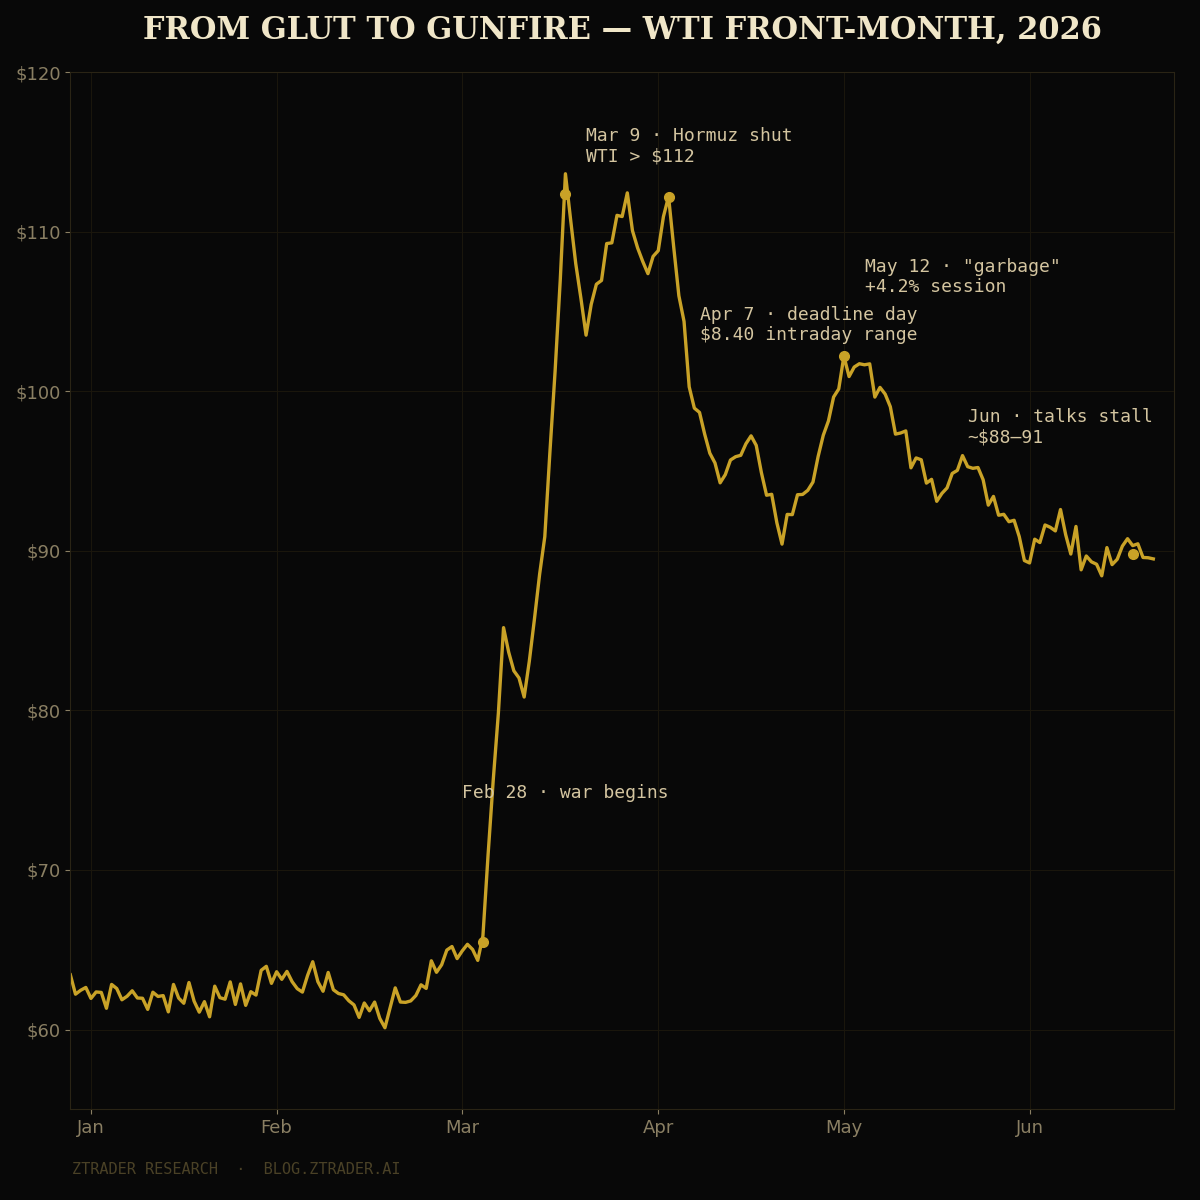
Hold that frame and the whole year snaps into focus. The pre-war market priced barrels: inventories, OPEC quotas, shale decline rates. The war market prices belief about duration. And belief about duration, in this conflict, has a single dominant input — which brings us to the microphone.
II. THE TRUMP FUNCTION
Model the president’s rhetoric as what it operationally is: a stochastic forcing function applied directly to the most inelastic point of the curve. The empirical record is brutal in its consistency. April 7, the self-imposed deadline to strike Iranian power plants and bridges: WTI traded an $8.40 intraday range, lurching two to three dollars in minutes on individual statements.
In May, when Tehran’s counteroffer was dismissed as “garbage” and the ceasefire declared on life support, front WTI jumped 4.2 percent in a session to $102.18. Weeks earlier, a single Reuters line about a second round of talks in Islamabad knocked the front month down 2.24 percent before lunch. And in the strangest tell of all, the March 9 musing about taking over the Strait of Hormuz — maximal escalation, on its face — sent crude down more than six percent, because the market read forcible reopening as supply restoration.
That last episode is the decoder ring.
The market is not pricing aggression or peace. It is pricing one variable only: expected days until tankers move.
Words that extend the clock are bought; words that shorten the clock are sold — regardless of how violent or conciliatory they sound. Trump’s mouth is not bullish or bearish. It is a volatility machine with a directional decoder attached, and the decoder runs on shipping logic, not politics.
The market is not pricing war or peace. It is pricing expected days until tankers move — and every sentence resets the clock.
Now layer on the asymmetry, because this is where directional traders go to die. After three months of closure, the war premium is owned. Everyone who wants the escalation trade already has it. So bullish headlines confirm what is priced — the jump is over before a human can click — while de-escalation headlines are genuinely new information and get a full repricing. Recent weeks made it explicit: WTI carved a six-week symmetrical triangle of frustration, then a single weekend of diplomatic progress broke it downward, with analysts flagging the path of least resistance as lower. Escalation rallies are sold into within hours; peace selloffs run for days. If your strategy is “buy the scary headline,” your payoff function is concave: you eat the tail of every rally and the entirety of every dump.
[CHART 2 — One Market Becomes Two: The WTI Curve in Three Regimes]
III. THE CREDIBILITY DECAY FUNCTION
One shock repriced the level. Repetition repriced the logic. The first ultimatum traded at face value.
By the fifth reversal — deadline, extension, “garbage,” talks, deadline again — the market was running a different algorithm entirely, and understanding that algorithm is worth more than any supply model.
Markets did not learn this discount in 2026.
They trained on the 2025 tariff cycle, where the threat-then-retreat pattern repeated often enough that Wall Street gave it a name and a trade. Oil imported that prior wholesale.
Each fresh ultimatum now trades at a deeper discount to face value than the last — which is why deadline day, the most theatrical escalation of the war, could not push the front month meaningfully above its March highs. The threat was being marked at perhaps half its sticker price.
But a discount is not a dismissal, and here is the subtlety that separates professionals from tourists: credibility decay lowered each statement’s impact on the expected value while raising its contribution to the variance.
The mouth migrated from the first moment of the distribution to the second. Statements stopped deciding where price goes and started deciding how wide the distribution is.
That is why a headline in either direction reignites implied volatility even when flat price barely moves — and why options desks now treat the presidential feed as a permanent, unscheduled vol event. Unlike CPI or an FOMC meeting, there is no calendar.
Event premium that would normally concentrate into known dates instead smears across the entire surface: the implied-vol floor sits permanently higher, and weekend gap risk — statements love Sunday — stays permanently bid.
The microstructure expression of all this is the spike-and-fade. Machines pay face value in the first seconds; institutional flow spends the next hours selling the credibility discount back out.
The canonical intraday shape of a Trump headline is now a vertical spike followed by a bleed — which carries a brutal corollary for anyone trading from Asia:
by the time the Tokyo session opens on a New York headline, the spike is the algo’s exit, gift-wrapped. Chasing it is not late entry. It is structurally volunteering for the fade.
He is inside the loop: the price his words create is the same price that forces his next words. The corridor is not a chart pattern — it is a thermostat finding its setpoint.
And beneath the decay function sits the deepest structure of all: reflexivity. The speaker watches the price his own speech creates, because crude is his personal pain index — gasoline at the pump, consumer sentiment at a fifty-year low of 49.8, a midterm map that punishes four-dollar gas. High oil forces conciliatory signals; falling oil restores the freedom to escalate. The result is a policy-generated trading corridor: the six-week symmetrical triangle that frustrated both sides was never technical congestion.
It was a control system hunting for its setpoint, with the controller inside the loop. Game-theoretically, this is a war of attrition with asymmetric cost visibility — Washington’s cost function is published weekly in sentiment surveys and pump prices, while Tehran’s is opaque. The curve’s standing verdict that Washington blinks first is not a political opinion. It is the market reading the only gradient it can see.
