

Dorian
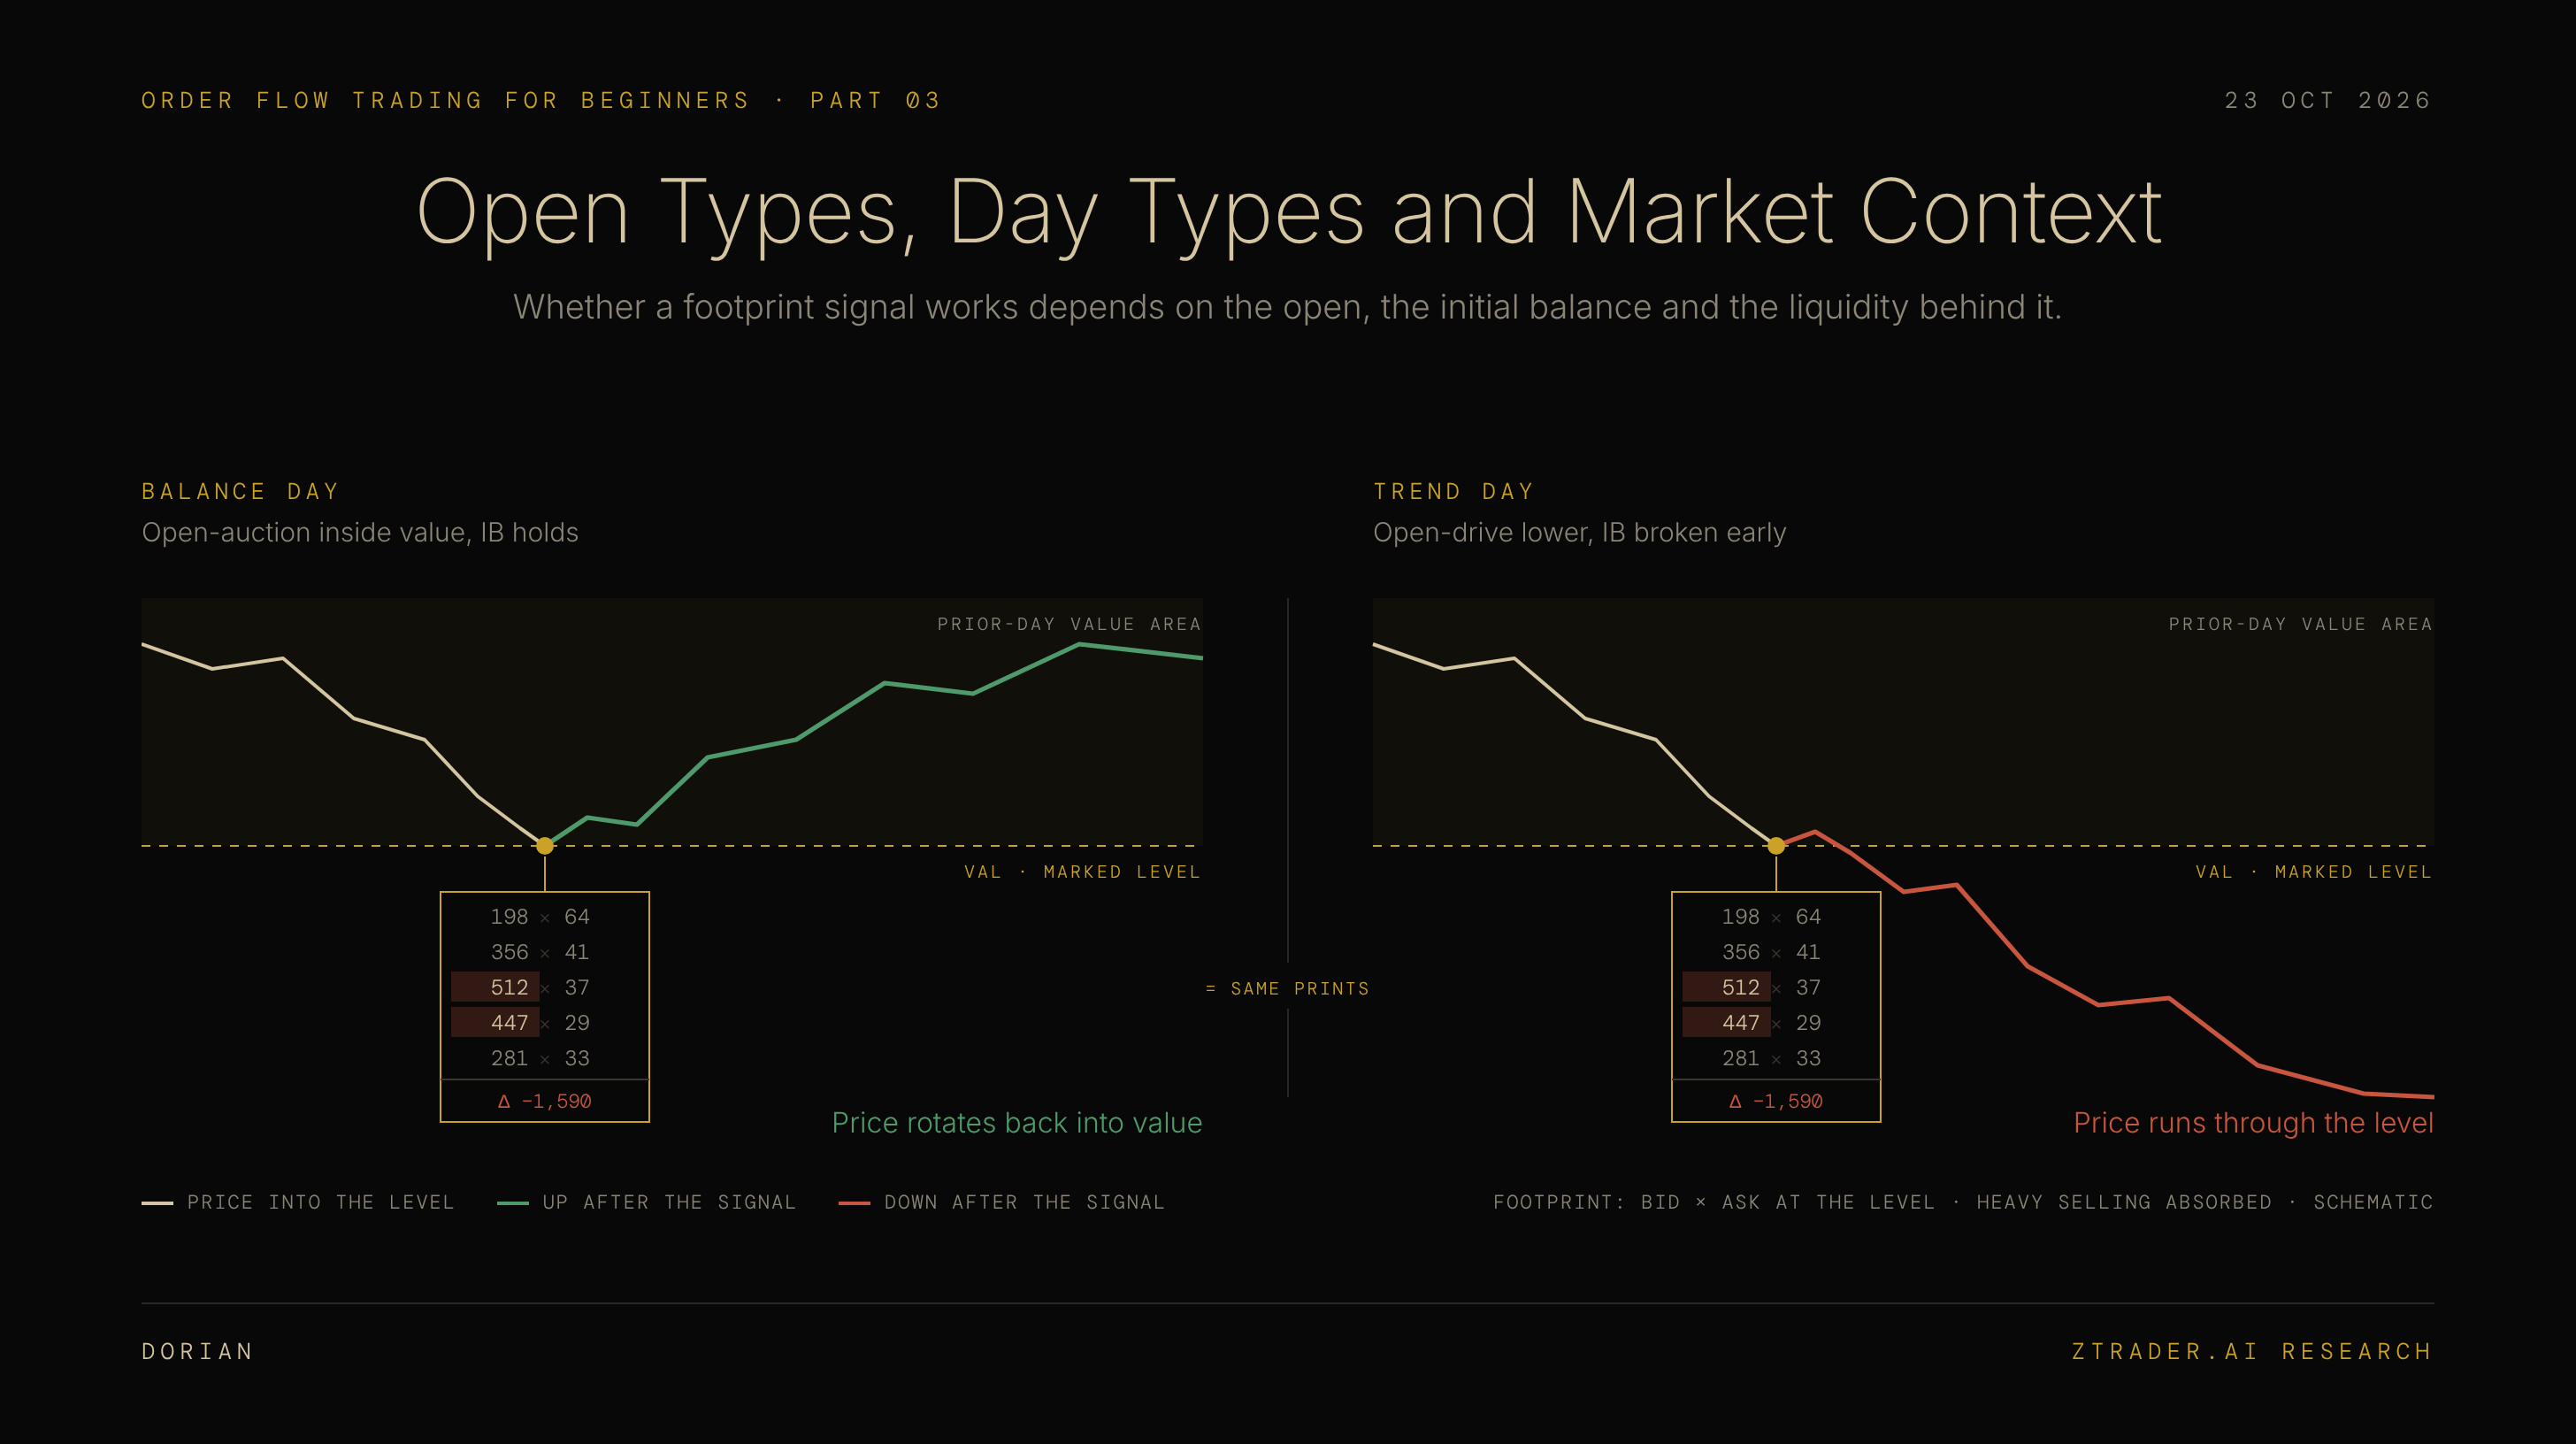
While footprint charts reveal trader behavior at specific price levels, they fail to contextualize the broader market environment. Absorption at the prior day’s low may signal a clean reversal during a low-volatility session, but the same footprint pattern will easily fail on a high-conviction trend day.
Following the framework in Part 2, your routine is defined: mark key levels pre-market, wait for price interaction, and enter upon confirming absorption, exhaustion, or initiative order flow. However, you will eventually observe identical signals yielding opposite results.
The underlying cause lies beyond basic entry criteria.
Every session represents a unique auction whose market condition is governed by four sequential variables:
Opening Placement relative to yesterday’s value.
Early Price Action during the first 30 minutes.
Range Extension Dynamics relative to the Initial Balance (first hour).
Liquidity Depth available in the limit order book.
Unfolding step-by-step throughout the day, these factors determine the true context—and ultimate reliability—of any footprint signal.
Key Improvements Made:
Parallel Structure: Fixed the contrast between “a quiet session” and “a trend day” to make the comparison sharper.
Readability: Converted the list of four market inputs into a bulleted or numbered format so the reader can absorb them at a glance.
Clarity & Precision: Cleaned up repetitive phrasing (e.g., “the reason sits outside the rules you wrote” →→ “lies beyond basic entry criteria” / “sits completely outside your standard entry rules”).
I. WHERE THE SESSION OPENS AGAINST YESTERDAY’S VALUE
Before the first footprint bar prints, the opening price already tells you how far the market starts from balance.
Three Opening Locations: How Far Out of Balance the Day Starts
Part 1 defined the value area as the range holding about 70% of a session’s volume, bounded by the value area high (VAH) and the value area low (VAL).
Yesterday’s value area and yesterday’s full range give you three places the new session can open:
1. Inside the prior value area: buyers and sellers agreed on these prices yesterday, so rotation between VAH and VAL is the base case until one edge gives way.
2. Outside the value area but inside the prior range: price starts away from where most of yesterday’s volume traded, and the value edge it opened away from is usually the first level to be tested.
3. Outside the prior range entirely: overnight trading has already repriced the market, and the first hour has to show whether traders accept those new prices or push price back into yesterday’s range.
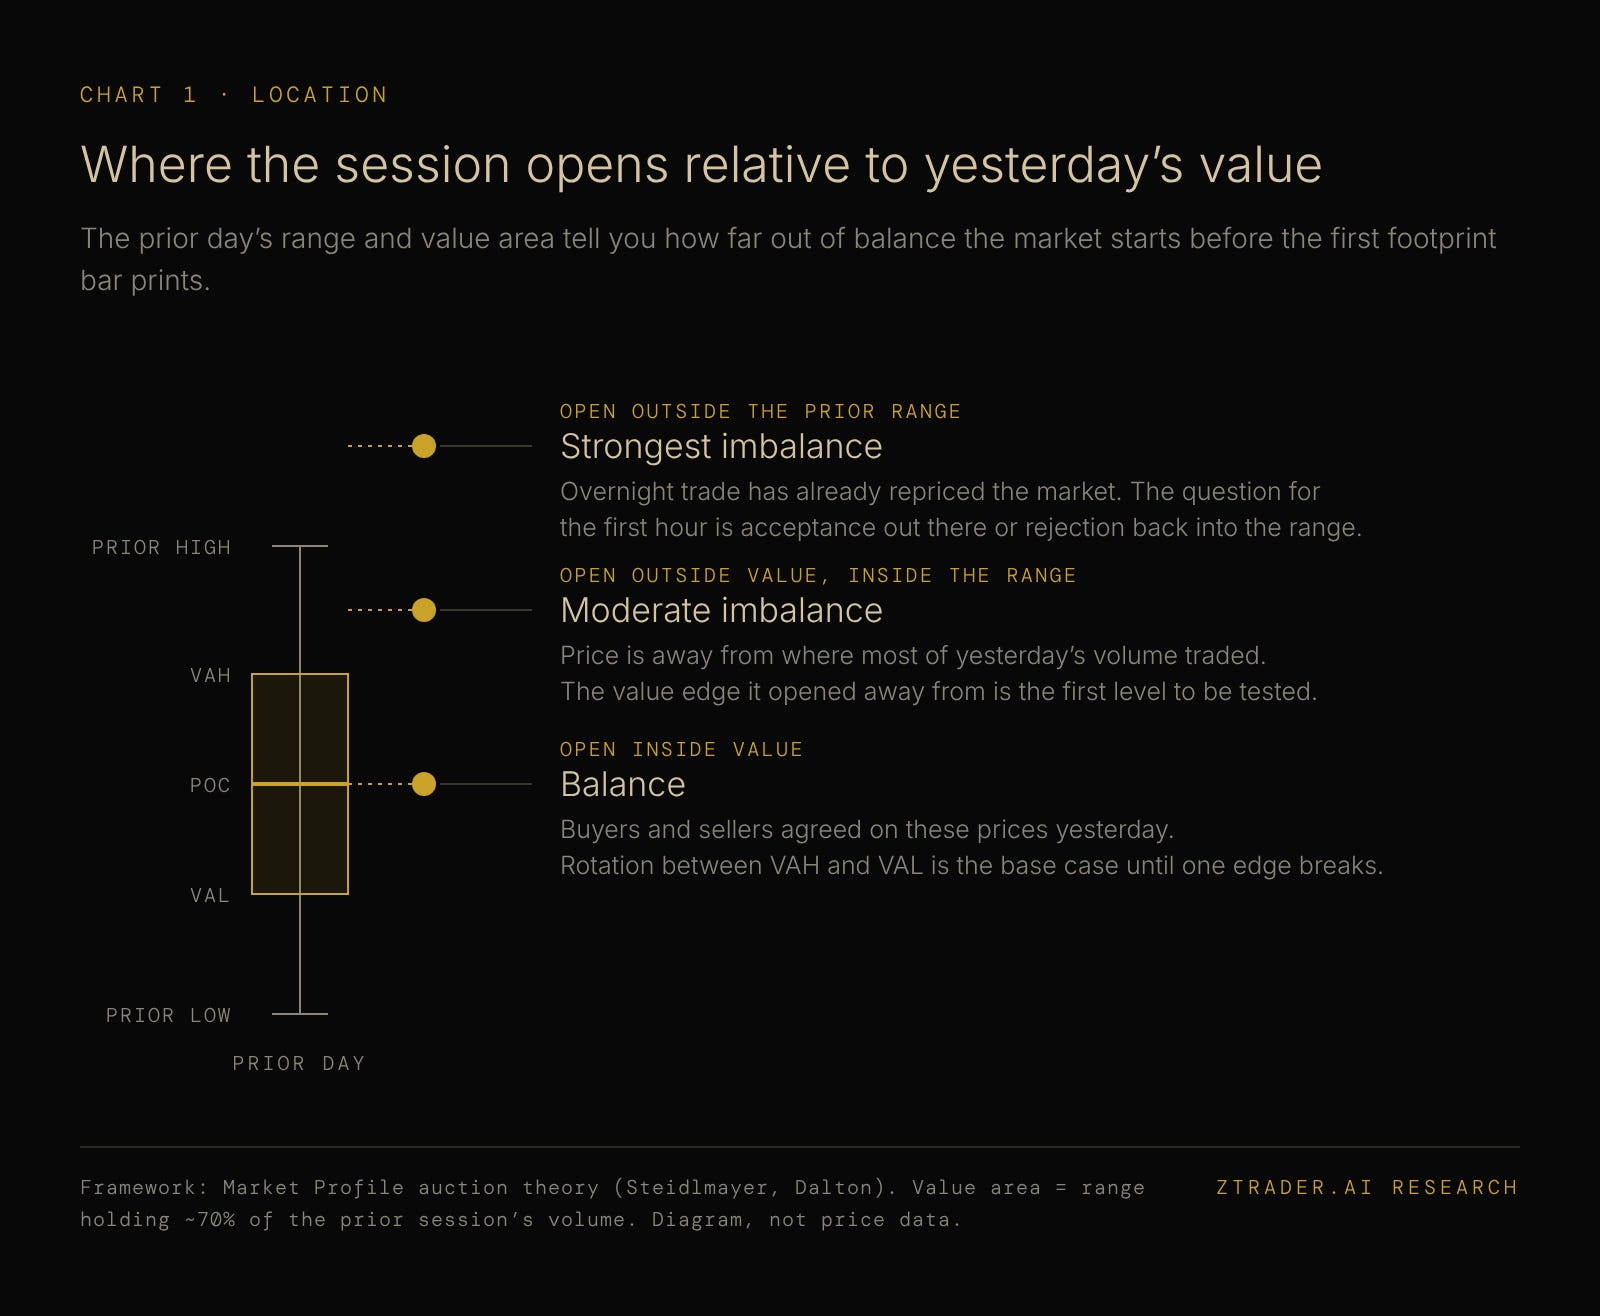
[CHART 1 — Where the session opens relative to yesterday’s value]
For Responsive and Initiative Traders:
There are two types of market participants will dictate the market session behavior. For responsive traders trade against price moves away from value—selling above value and buying below it—on the expectation that price will revert to fair value.
Initiative traders trade with price moves away from value—buying above value or selling below it—on the conviction that fair value itself is shifting.
An open inside the prior day’s value area favors responsive activity, whereas an open outside the prior range indicates that initiative traders drove price overnight and must now defend their positions.
For Overnight Inventory:
The Positions Already on the Books Overnight inventory represents the net positioning built during the Globex session ahead of the 9:30 AM ET open.
One standard practitioner method to assess this is comparing the overnight high-volume node against the prior day’s settlement price: if the bulk of volume traded above settlement,inventory is net long; if below, it is net short.
When overnight inventory is heavily skewed to one side, the first 30 to 60 minutes frequently produce a counter-auction driven by overnight profit-taking, temporarily pushing price against the overnight direction.
Conversely, the absence of a counter-auction signals that higher-timeframe buyers or sellers are aligned with the overnight move—one of the earliest indicators of a potential trend day.
The opening location sets the question for the day, and the open itself starts answering it.
II. THE FIRST THIRTY MINUTES AND THE FOUR OPEN TYPES
Once the market opening bell rings, the momentum and speed with which price departs the opening print reveal the conviction level of the early market players.
Dalton’s Four Open Types, Ranked by Conviction James Dalton’s Market Profile framework categorizes the opening price action into four distinct types, ranked from highest to lowest initial conviction.
Each type generates a clear,recognizable signature on the footprint chart:
Open-Drive: Price drives aggressively in one direction from the opening bell without ever auctioning back through the open. The footprint displays stacked aggressive imbalances in the direction of the drive, while counter-trend pullbacks reflect only weak, low-volume opposing delta.
Open-Test-Drive: Price first probes a nearby key level—such as yesterday’s low or the overnight low—meets zero business, and then forcefully drives in the opposite direction. The initial probe prints as clear exhaustion with drying volume at the extreme, followed by initiative imbalances carrying price decisively back through the open.
Open-Rejection-Reverse: The initial push encounters heavy absorption at its extreme, forcing price to reverse back through the opening print. This opposing move is generally slower and more two-sided than a pure drive, either building into an outright reversal trend or grinding into a balanced range.
Open-Auction: Price chops around the opening price in two-sided rotational trading, characterized by flat delta and an absence of stacked imbalances, indicating the market has yet to find direction.
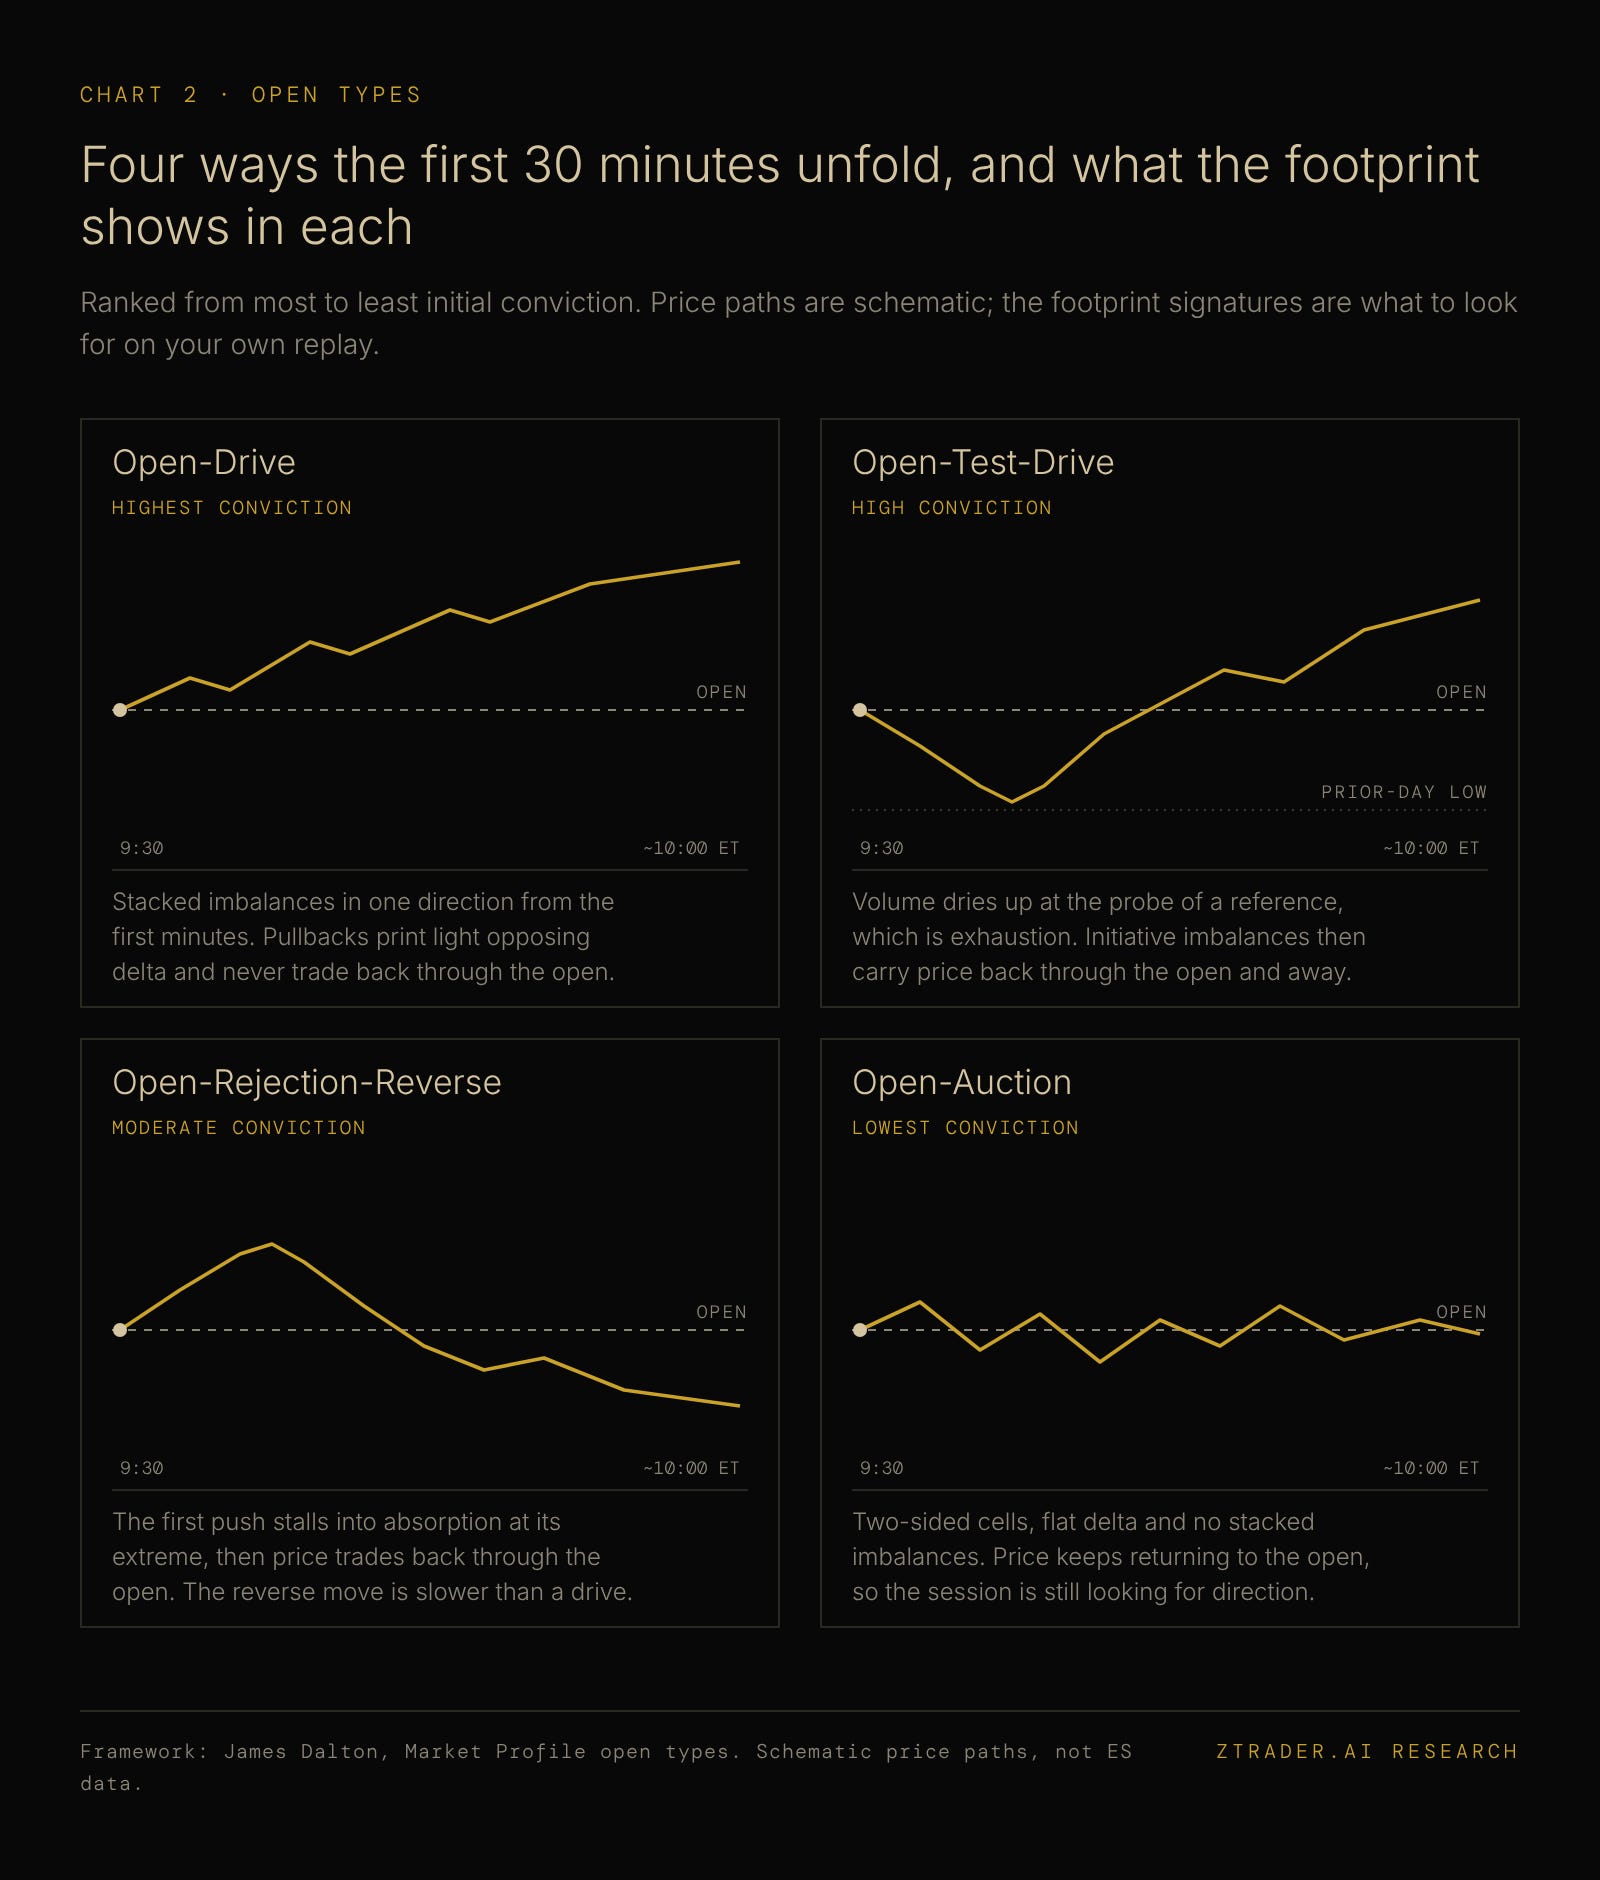
[CHART 2 — Four ways the first 30 minutes unfold, and what the footprint shows in each]
Reading the Open From the Bars That Follow
Thirty minutes is enough to assign a label, but the label stays a working one. ES trades through the 9:30 ET bell without a pause, so the open type is read from how price behaves after 9:30, bar by bar, against the opening price. When an open-drive stalls and starts rotating, the label changes to match what the footprint now shows.
The open type tells you how much conviction the first traders brought, and the first hour tests whether anyone else agrees.
III. WHAT THE INITIAL BALANCE SAYS ABOUT THE MARKET DAY
Part 2 marked the initial balance as two more levels on the chart, and here it becomes the frame that classifies the whole session.
Range Extension: The Test the First Hour Sets
The initial balance (IB) is the range of the first hour of the regular session, from 9:30 to 10:30 ET.
For any trade beyond the IB high or IB low after it completes is called range extension, and the way price extends, or fails to, maps the session onto the day types developed by Peter Steidlmayer and James Dalton:
1. No range extension: the session stays inside the IB. With a wide IB this is a normal day, and with a narrow, quiet IB it is a non-trend day, which can show up on quiet days ahead of major scheduled news.
2. One extension that stalls: price breaks one side of the IB, the range grows to about twice the IB, and new value builds around the extension. This is a normal variation day.
3. One extension that keeps going: price breaks a narrow IB early, rotates very little afterward, and closes near the extreme of the day. This is a trend day.
4. Extension, pause, then extension again: the session builds two separate value zones with a thin, fast area between them. This is a double distribution day, and that thin area behaves like the low volume nodes from Part 1.
5. Extension on both sides: price breaks both the IB high and the IB low. If it closes mid-range it is a neutral center day, and if it closes at one extreme it is a neutral extreme day.
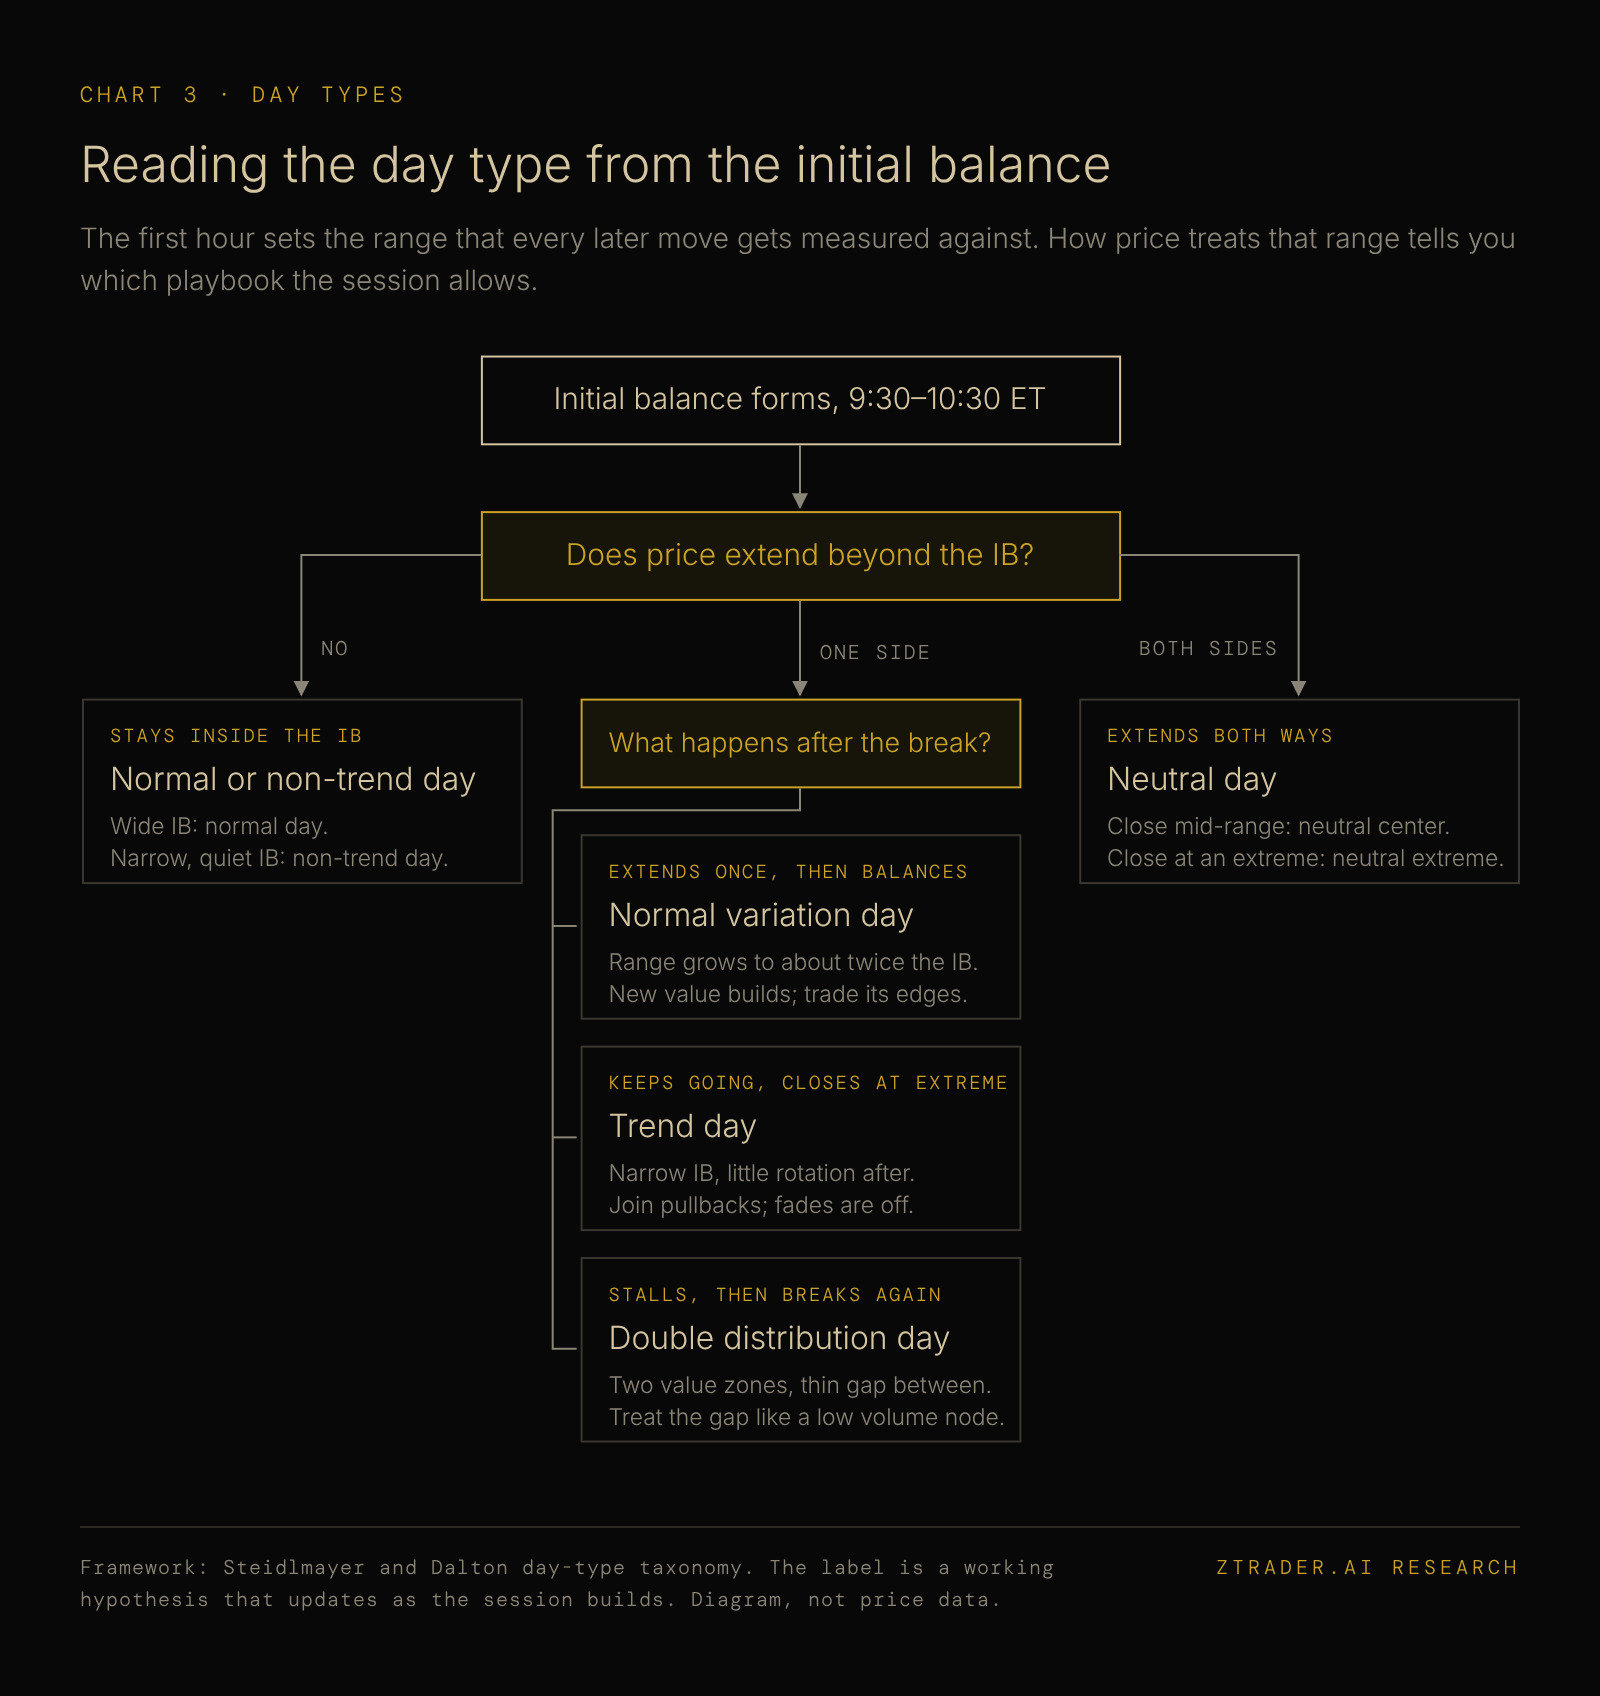
[CHART 3 — Reading the day type from the initial balance]
Why the Label Stays a Hypothesis
Day types are confirmed only at the close, so during the session they work as a hypothesis that updates every time price extends or fails to extend. Published counts of how often each type occurs disagree widely between sources, so no frequency should guide your expectations.
What matters is the direction of the evidence, because a narrow IB broken early with no return points toward a trend day, while a wide IB that holds all morning points toward rotation.
The initial balance turns the open’s first impression into a working classification of the day.
